Core Web Vitals & Performance
First Contentful Paint (FCP): What It Is, Why It Matters, and How to Fix It
By Robert Belkin, Founder & Lead Strategist
Published · Reviewed by Robert Belkin · 7 min read
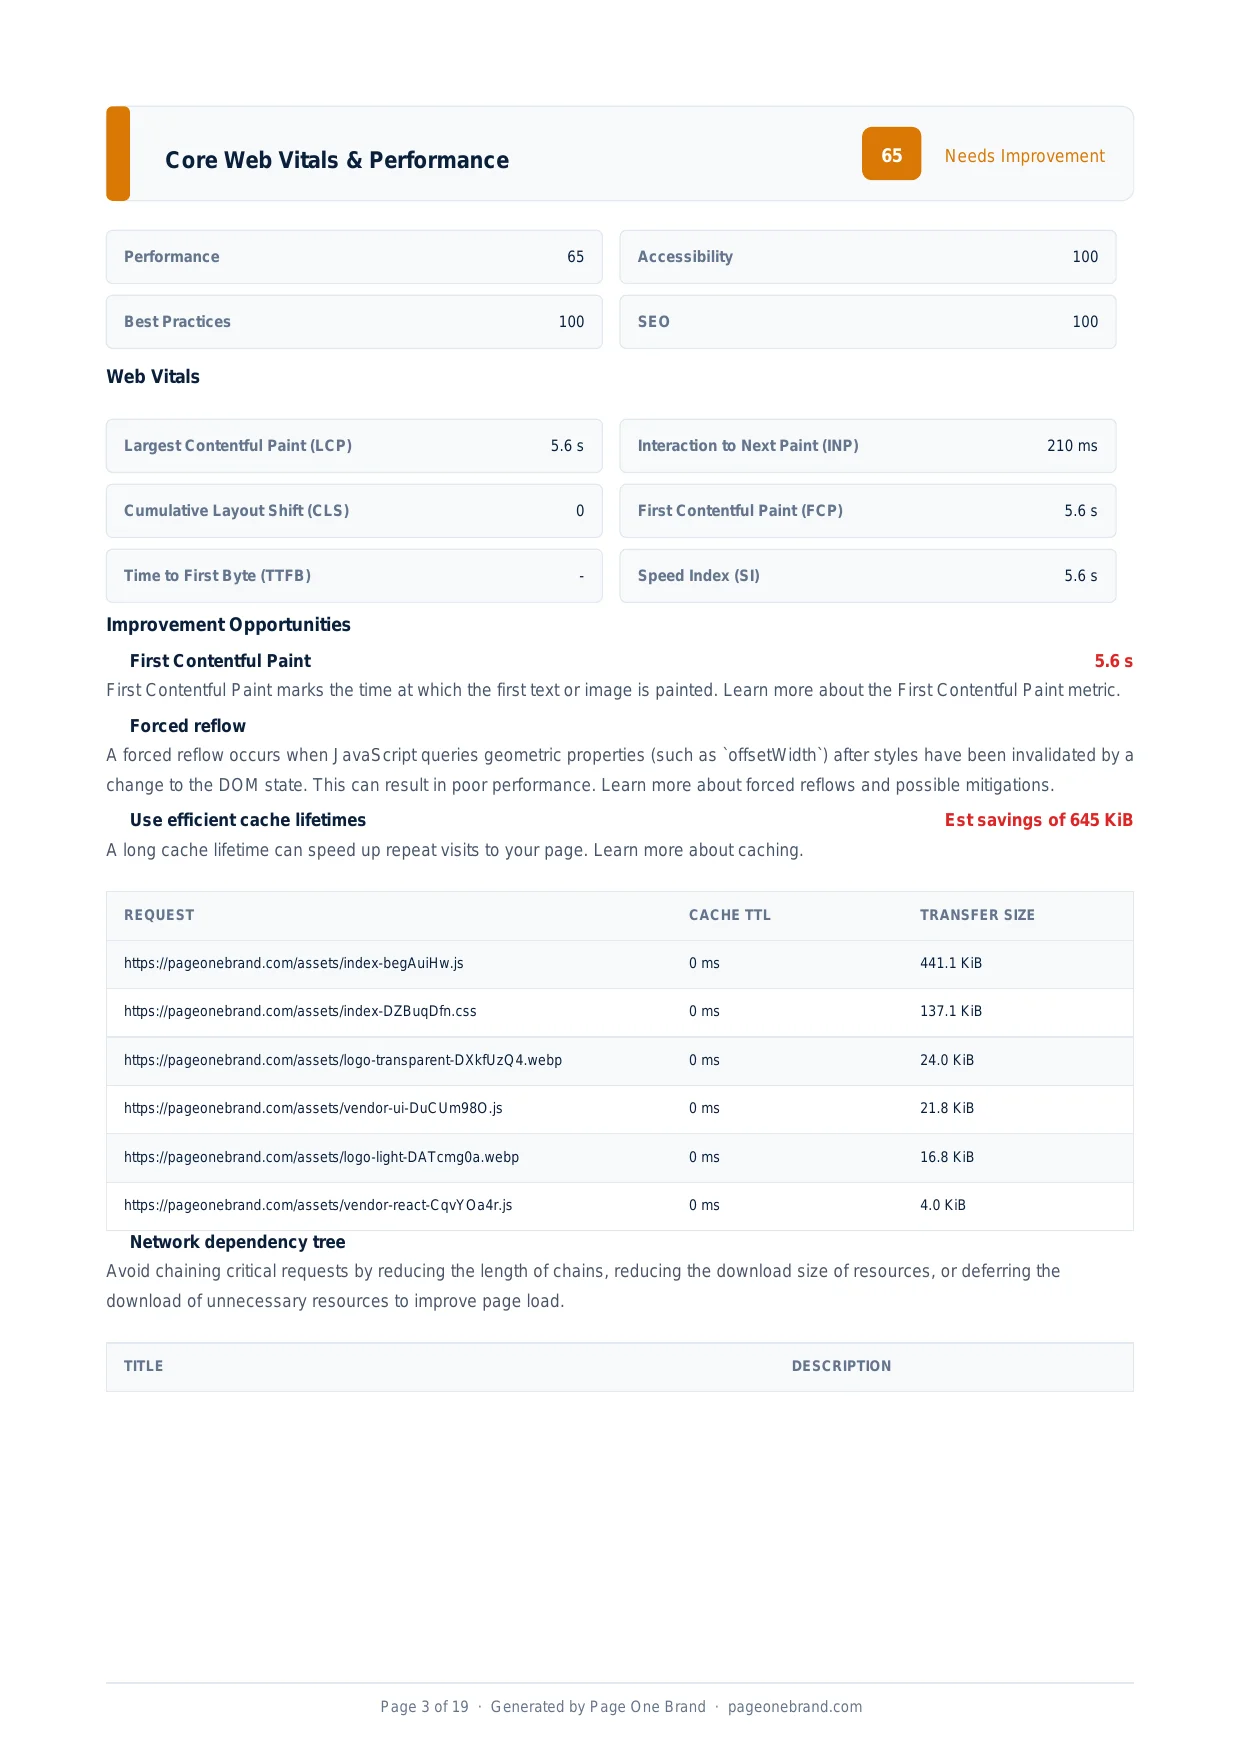
First Contentful Paint — or FCP — is the moment the browser renders the first piece of content on screen: a heading, a paragraph, a logo, anything that tells the user the page is actually loading. It is one of the first signals in the Core Web Vitals family, and a slow FCP is often the difference between a user who waits and a user who leaves.
What FCP Actually Measures
FCP marks the time from when navigation begins to when the browser paints the first non-empty content in the viewport. That content can be text, an image, an SVG, or a non-white canvas element — but not background images via CSS, which do not count.
Google's Lighthouse and the Chrome User Experience Report (CrUX) both measure FCP. The thresholds are: good below 1.8 seconds, needs improvement between 1.8 and 3 seconds, and poor above 3 seconds. Lab data from Lighthouse measures what happens in a controlled test environment; field data from CrUX reflects real user sessions over the past 28 days.
These two numbers often differ. Lab FCP runs on a simulated device with throttled network. Field FCP reflects the full distribution of your real users — including those on slow connections or older devices. If your lab FCP looks good but your field data is poor, your actual user base is experiencing something your test environment is not reproducing.
The Performance section of a Page Quality Analyzer report — FCP and LCP are the first metrics to target because they govern the first impression users form of your page.
Why a Slow FCP Hurts More Than Your Score
A slow FCP is a broken first impression. When a user navigates to a page and nothing appears for two or three seconds, the instinctive reaction is that something is wrong. Bounce rates climb sharply once FCP crosses the two-second threshold. Studies from Google and Deloitte have consistently shown that each 100-millisecond improvement in page load correlates with a 1-2% improvement in conversions.
FCP also influences how Google perceives your page quality. While Google has said Core Web Vitals are a tiebreaker rather than a primary ranking signal, pages that score poorly on CrUX data for FCP receive a reduced page experience score. In competitive markets where content quality is otherwise equal, that can push a page off the first page of results.
The Four Root Causes of Slow FCP
1. Render-blocking resources. Any stylesheet or synchronously loaded script in the head that must be downloaded and processed before the browser can paint anything. Use rel="preload" for your critical CSS, move non-critical scripts below the fold, and add async or defer attributes to third-party scripts.
2. A slow server response (high TTFB). If the HTML itself takes two seconds to arrive, FCP cannot happen before that. A CDN in front of static content and proper server-side caching are the fastest fixes here.
3. Large HTML payloads. If your initial HTML document is hundreds of kilobytes, the browser must download the full document before it can parse and render any of it. Compressing responses with Brotli or gzip helps significantly.
4. Client-side rendering. Single-page applications that ship an empty HTML shell and then render everything via JavaScript will always have a slower FCP than server-rendered pages. Server-side rendering (SSR) or static generation (SSG) moves FCP significantly.
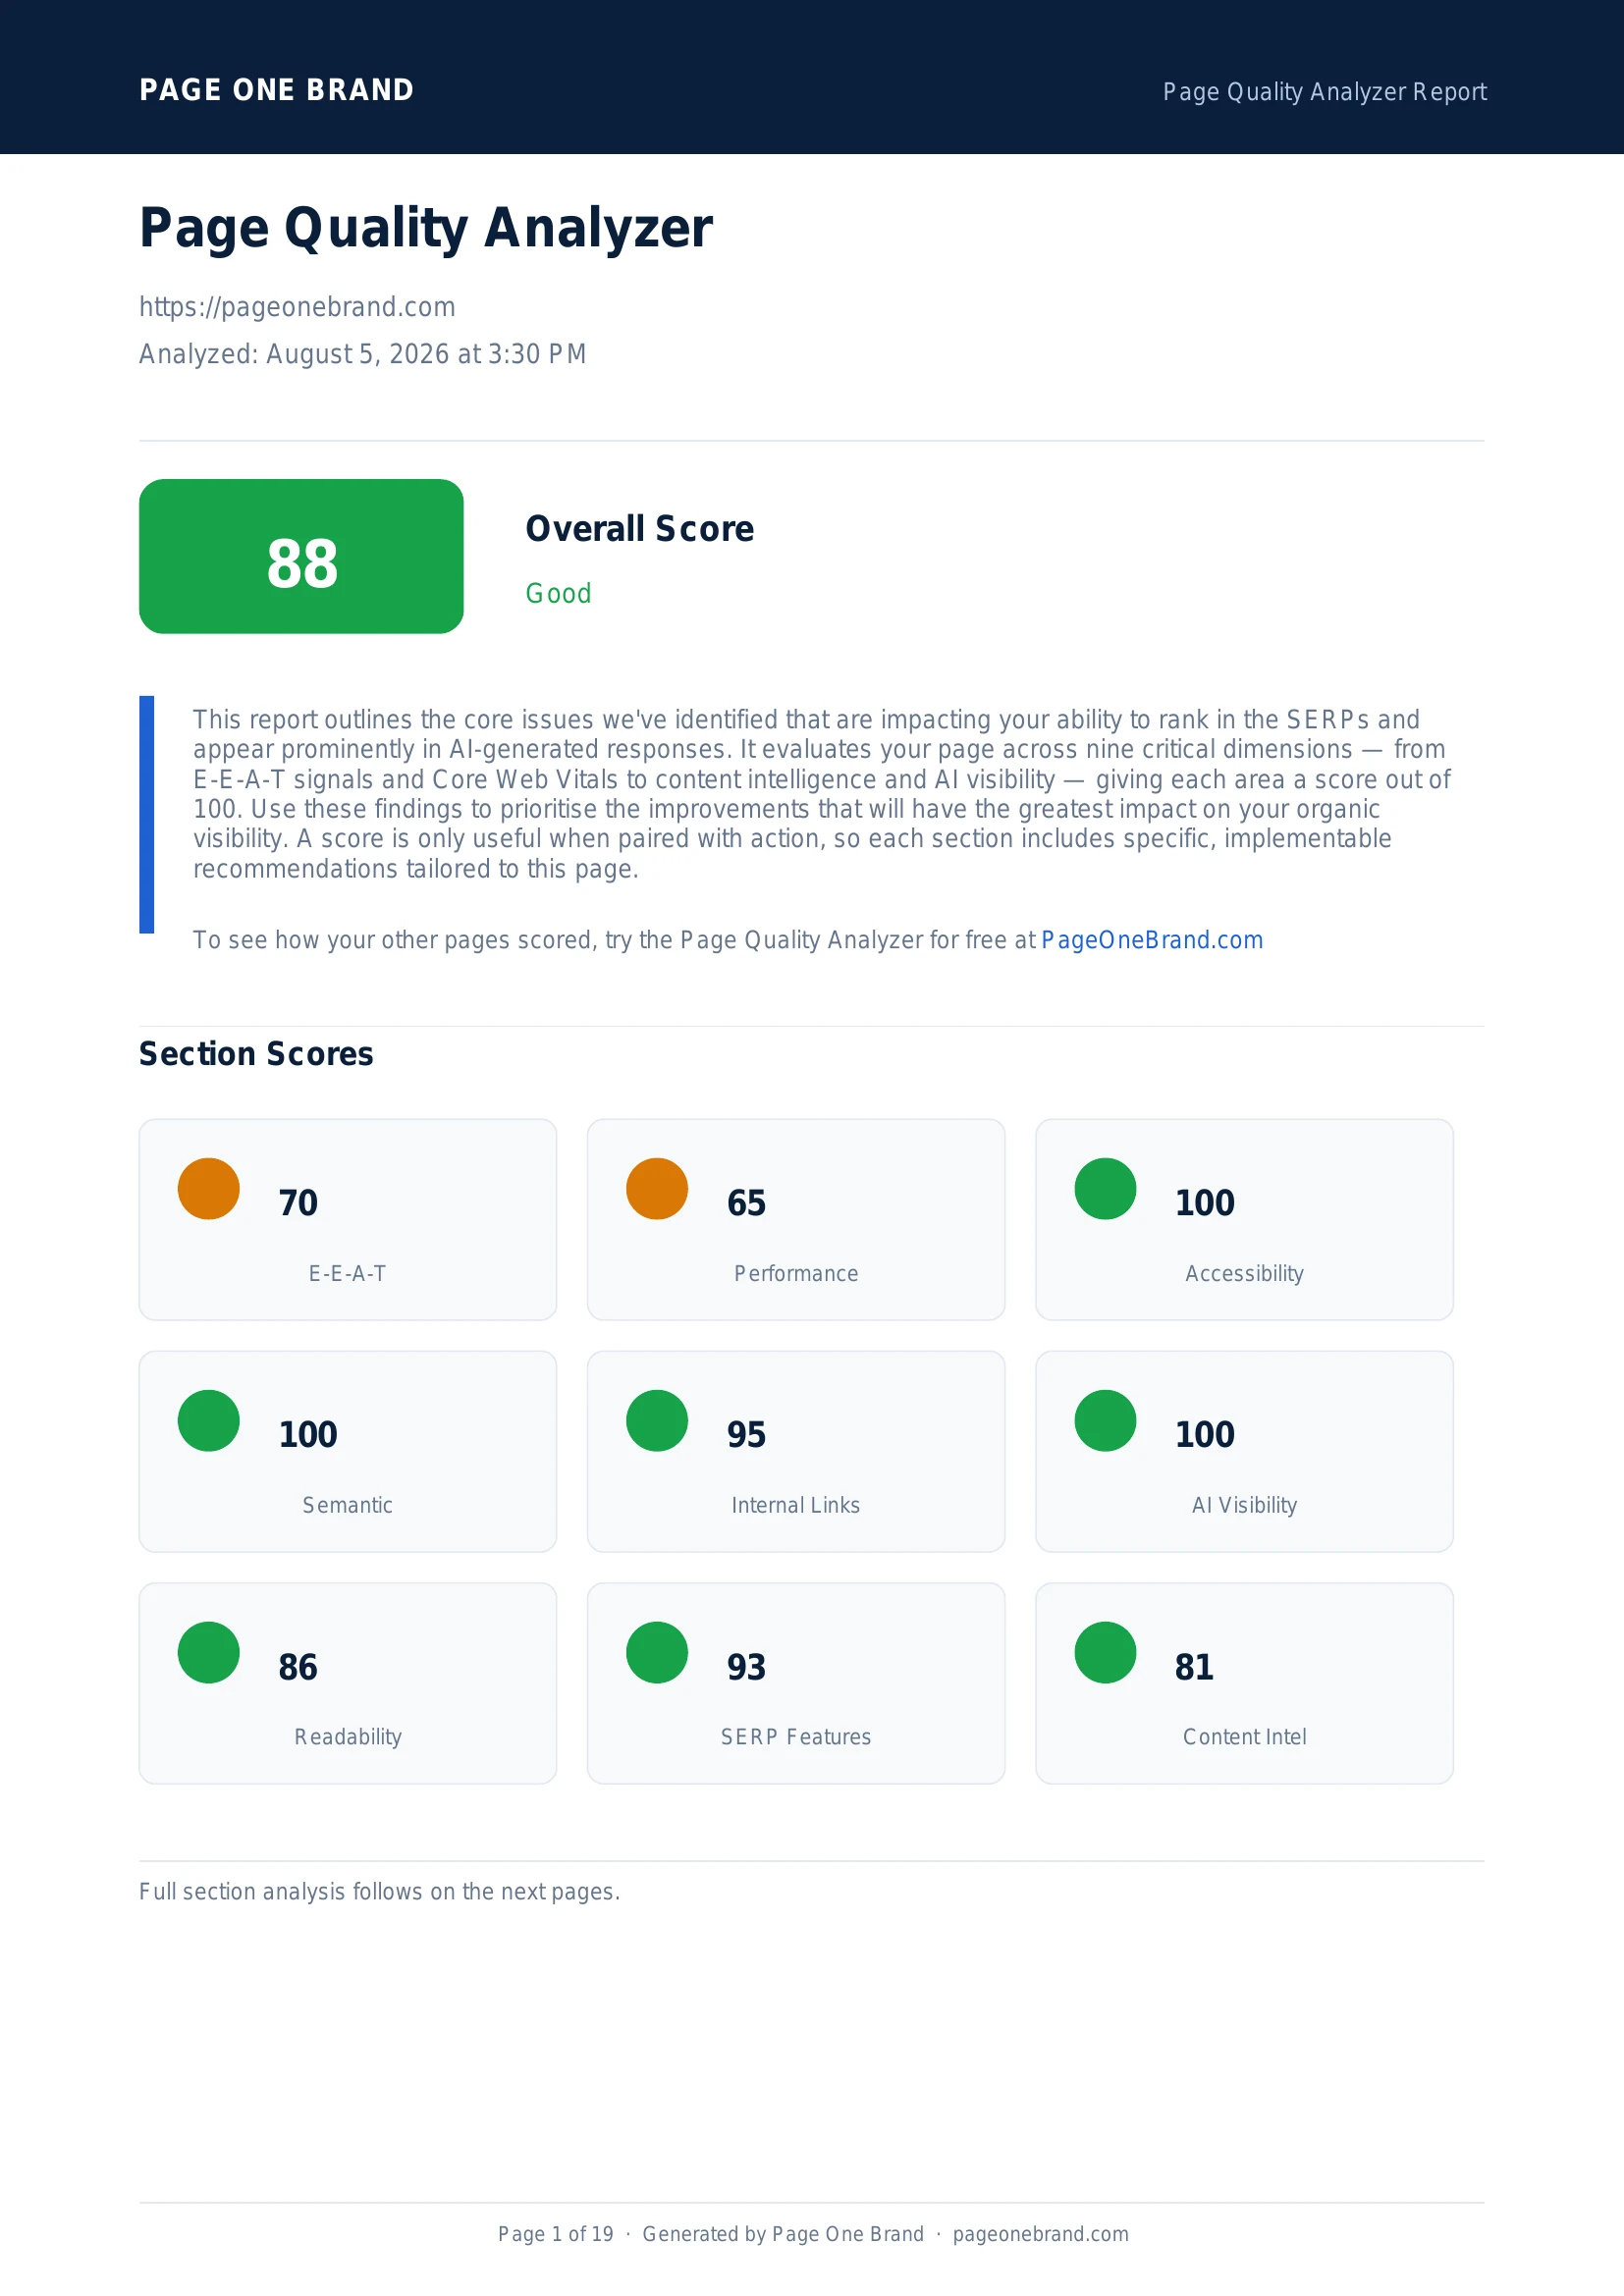 A full Page Quality Analyzer report — the Performance score reflects FCP, LCP, Speed Index, and the other Core Web Vitals in combination.
How to Fix a Poor FCP Score
Start with what Lighthouse tells you. The Opportunities panel in the Performance section lists specific resources and estimated savings. Work through them in order of impact.
Beyond the specific suggestions: add rel="preconnect" hints for third-party origins you depend on. Use rel="preload" for the CSS file that styles your above-the-fold content. Move all non-critical JavaScript to the end of the body or load it with defer. Enable Brotli compression on your server. And if you are on shared hosting, consider switching to a platform with lower baseline TTFB — the difference between a 300ms and 800ms server response directly determines how fast FCP can ever be.
FCP is one of the fastest performance metrics to move meaningfully in a single sprint because many of its causes are configuration-level changes rather than deep architectural ones. Fix the render-blocking resources, tighten your server response time, and you will see FCP improve the next time you run the Page Quality Analyzer.
FCP vs LCP vs Speed Index: Core Web Vitals Thresholds at a Glance
FCP is one of several timing metrics Google uses to evaluate perceived performance. Understanding where it sits relative to the other vitals helps you prioritise work correctly.
| Metric | Good | Needs Improvement | Poor | Lighthouse Weight |
|---|
| First Contentful Paint (FCP) | < 1.8 s | 1.8 – 3.0 s | > 3.0 s | 10% |
| Largest Contentful Paint (LCP) | < 2.5 s | 2.5 – 4.0 s | > 4.0 s | 25% |
| Speed Index (SI) | < 3.4 s | 3.4 – 5.8 s | > 5.8 s | 10% |
| Time to First Byte (TTFB) | < 800 ms | 800 ms – 1.8 s | > 1.8 s | — |
| Total Blocking Time (TBT) | < 200 ms | 200 – 600 ms | > 600 ms | 30% |
| Cumulative Layout Shift (CLS) | < 0.1 | 0.1 – 0.25 | > 0.25 | 25% |
Lab Data vs Field Data: Understanding the Difference
FCP is reported in two distinct ways, and understanding the difference is critical for correctly diagnosing a performance problem.
Lab data (Lighthouse). Lighthouse runs in a controlled environment using a simulated mid-range Android device on a throttled 4G connection. Every run is deterministic — it measures what would happen under those specific conditions. Lab data is fast to collect and actionable: you can run it on any URL immediately and see the impact of changes. The downside is that your actual user base may be on entirely different hardware and network conditions.
Field data (Chrome User Experience Report — CrUX). CrUX collects real FCP measurements from Chrome users who have opted in to sharing performance data. Google aggregates these over a rolling 28-day window and reports them at the 75th percentile — meaning 75% of your real users must experience FCP below the threshold for your site to pass. Field data appears in the Chrome User Experience Report, PageSpeed Insights, and Google Search Console's Core Web Vitals report.
The practical consequence: a site can have an excellent Lighthouse FCP of 1.2s but a poor CrUX FCP of 3.8s if most real users are on slow connections or the site serves regions far from the server. Always check both sources. The Google PageSpeed Insights API returns both in a single request and is the data source used by the Page Quality Analyzer.
FCP Optimisation Priority Checklist
- Eliminate render-blocking CSS. Inline the critical CSS required for above-the-fold content. Use tools like Critical, Critters, or Penthouse to automate extraction. Load the full stylesheet asynchronously with
rel="preload" and an onload handler.
- Reduce TTFB first. FCP cannot happen before the HTML document arrives. A CDN, proper server-side caching, and database query optimisation all reduce TTFB. Target below 800ms.
- Add
async or defer to third-party scripts. Every synchronous script in <head> that must download before the browser can continue parsing delays FCP. Analytics, chat widgets, and advertising scripts are the main culprits.
- Add
rel="preconnect" for critical third-party origins. If your fonts come from Google Fonts, your CDN is a separate subdomain, or your analytics comes from a third-party server, a preconnect hint lets the browser establish the TCP/TLS handshake in advance.
- Enable Brotli compression. Brotli compresses HTML and CSS 20–26% better than gzip. Smaller payloads download faster, improving both TTFB and FCP. All modern browsers support Brotli.
- Switch to server-side rendering or static generation for JavaScript-heavy pages. SPAs that ship an empty HTML shell cannot render anything until JavaScript executes. SSR or static generation moves the FCP forward to when the HTML is received, not when JavaScript finishes.
- Reduce initial HTML document size. Large HTML payloads delay the point at which the browser can begin parsing and painting. Remove unused HTML generated by CMS themes or page builders.
- Use
rel="preload" for your hero font. If the first visible text uses a custom web font, preloading the font file means it is available before the browser needs it, preventing the Flash of Invisible Text (FOIT) that delays FCP.
Frequently Asked Questions About First Contentful Paint
Does FCP directly affect Google rankings?
FCP is part of the Core Web Vitals assessment that feeds into Google's page experience signal. Google has described Core Web Vitals as a tiebreaker — when two pages are otherwise equivalent in content quality, the one with better Core Web Vitals may rank higher. FCP itself is not a direct ranking factor in isolation, but it contributes to the overall performance assessment alongside LCP, CLS, and INP. Poor FCP also increases bounce rates, which indirectly affects how Google perceives page quality.
What is the difference between FCP and TTFB?
Time to First Byte (TTFB) is the delay between a browser requesting a page and receiving the first byte of the HTML response. It is a server-side metric. FCP is a browser-side metric: it measures how long after navigation begins the browser renders the first visible content. TTFB is a prerequisite for FCP — FCP cannot happen faster than TTFB. A high TTFB will always produce a high FCP. But even with a fast TTFB, a page can still have a slow FCP if render-blocking resources or large scripts prevent the browser from painting anything.
Why does my Lighthouse FCP look good but Search Console shows a failing FCP?
Lighthouse runs on a simulated device under controlled conditions. Google Search Console reports CrUX field data collected from real Chrome users over 28 days, measured at the 75th percentile. Your actual users may be on mobile devices with limited CPU, on slow 3G connections, in geographic regions far from your server, or running browser extensions that add overhead. If lab and field FCP diverge significantly, investigate using the PageSpeed Insights API to see both side by side, then use Chrome DevTools with device emulation set to match your typical user profile.
Is FCP the same as LCP?
No. FCP measures when the browser first renders any content — a single pixel of text, a small icon, anything. LCP measures when the largest content element in the viewport finishes rendering. On most pages, FCP happens first and LCP follows. The gap between them — the time from first-paint to largest-paint — is where the perceived loading experience lives. A fast FCP followed by a slow LCP means the page appeared to start loading but felt slow to actually load. Both metrics require separate attention and often have different root causes.
Step-by-Step: Diagnosing FCP with PageSpeed Insights
Google PageSpeed Insights (PSI) is the fastest way to diagnose what is causing a slow FCP on any public URL. Here is the exact workflow:
- Run the URL through PSI. Go to pagespeed.web.dev and enter your URL. PSI returns both field data (from CrUX) and lab data (from Lighthouse) in a single report. Check the FCP value in the field data first — this is what real users are experiencing. Then look at the lab data to diagnose why.
- Check the Opportunities panel. Below the scores, PSI lists specific Opportunities with estimated time savings. Look for: "Eliminate render-blocking resources," "Reduce server response times (TTFB)," "Avoid chaining critical requests," and "Minify CSS." Each entry names the specific files causing the delay.
- Open the Lighthouse waterfall. In the lab results, scroll to the Diagnostics section. The "Critical Request Chains" diagnostic shows exactly which resources are in the critical path for first paint — the chain that must resolve before the browser can render anything. Every resource in this chain directly adds to your FCP time.
- Identify the longest chain link. Common culprits: a Google Fonts stylesheet loaded via a
<link rel="stylesheet"> in the head (blocks rendering for the full DNS + TCP + download time), a render-blocking JavaScript file, or a redirect chain adding a full round-trip to TTFB.
- Fix in priority order. Tackle the longest chain link first. A single render-blocking stylesheet that takes 600ms to download is worth more effort than ten 20ms resources.
The Critical Rendering Path: Why CSS Blocks FCP
The browser cannot paint anything until it has both the DOM (HTML parsed) and the CSSOM (all CSS parsed). Any stylesheet in the <head> that is not loaded asynchronously creates a render-blocking resource — the browser stops parsing, downloads the stylesheet in full, parses the CSS, builds the CSSOM, and only then continues. This pause directly increases FCP.
The standard fix is to split your CSS into critical (above-the-fold styles) and non-critical (everything else), inline the critical CSS in the <head>, and load the full stylesheet asynchronously:
<!-- Inline critical CSS directly in <head> -->
<style>
  /* Only the styles needed for above-the-fold content */
  body { margin: 0; font-family: system-ui, sans-serif; }
  .hero { display: flex; flex-direction: column; padding: 2rem; }
  h1 { font-size: 2.5rem; line-height: 1.2; }
</style>

<!-- Load full stylesheet asynchronously -->
<link rel="preload" href="/styles/main.css" as="style"
      onload="this.onload=null;this.rel='stylesheet'">
<noscript><link rel="stylesheet" href="/styles/main.css"></noscript>
Tools that automate critical CSS extraction: Critical (npm package by Addy Osmani), Critters (used internally by Angular and Next.js), and Penthouse (headless Chrome-based extractor). All three analyse a rendered page and extract the CSS rules that apply to the above-the-fold viewport.
For web fonts, the equivalent fix is font-display: swap. Without it, browsers using FOIT (Flash of Invisible Text) show blank text until the font file downloads — effectively delaying FCP to the point when the font arrives. With font-display: swap, the browser immediately renders text in a fallback font, hitting FCP, then swaps to the custom font when it loads:
@font-face {
  font-family: 'MyFont';
  src: url('/fonts/myfont.woff2') format('woff2');
  font-display: swap; /* render immediately in fallback, swap later */
}
Before and After: Real FCP Improvements
The following examples illustrate the FCP gains achievable through targeted fixes. These reflect representative outcomes from the types of optimisations described in this guide.
| Site type | Before | After | Primary fix |
|---|
| WordPress blog with 3 render-blocking stylesheets | 3.8 s FCP | 1.4 s FCP | Inlined critical CSS; deferred plugin stylesheets |
| React SPA with client-side rendering | 4.2 s FCP | 1.1 s FCP | Switched to Next.js SSR; serves HTML with content from TTFB |
| E-commerce site with slow shared hosting | 5.1 s FCP | 1.9 s FCP | Moved to CDN-fronted hosting; TTFB dropped from 2.8 s to 0.4 s |
| Marketing site with Google Fonts in <head> | 2.6 s FCP | 1.3 s FCP | Added <link rel="preconnect"> for fonts.googleapis.com; added font-display: swap |
The common pattern across all four examples: every significant FCP improvement came from either reducing TTFB (server response time) or eliminating render-blocking resources. Cosmetic changes — image compression, layout adjustments, copy edits — have zero effect on FCP. Fix the critical rendering path first.
FCP, INP, and CLS: The Full Page Experience Picture
FCP is one of three Core Web Vitals that Google uses in its page experience signal. Understanding how they interact helps you prioritise correctly.
- FCP (First Contentful Paint) — first impression. Determines whether users wait or bounce before the page shows anything.
- INP (Interaction to Next Paint) — responsiveness. Measures how quickly the page responds to every click, tap, and key press throughout the session. Good threshold: below 200ms. INP replaced FID as a Core Web Vital in March 2024.
- CLS (Cumulative Layout Shift) — stability. Measures how much content shifts during and after load. A high CLS score means images, text, or buttons jump position as the page loads, causing mis-clicks and a disorienting experience. Good threshold: below 0.1.
A page can have a fast FCP but terrible CLS — content appears quickly but jumps around, frustrating users. Or fast FCP with high INP — the page looks done but clicks are unresponsive. Google's page experience assessment requires all three to be in the Good range. FCP is the starting point; INP and CLS require separate investigation.
Editorial implementation brief · Performance
FCP triage: identify whether the delay is server, network, or rendering
FCP cannot happen before the HTML arrives, but a fast response can still paint late if CSS, fonts, or JavaScript block the first render. Measure the chain before changing code.
What to check, in order
- Record TTFB and FCP together in PageSpeed Insights; a high TTFB points to the server or network first.
- Inspect the filmstrip and request waterfall for render-blocking CSS, synchronous scripts, and font delays.
- Inline only the critical CSS needed for the initial viewport; defer the rest rather than copying the entire stylesheet into HTML.
- Use
defer for scripts that are not needed to build the first view, and preconnect only to origins the first view actually uses. - Compare mobile field data with lab data after each release; a lab improvement is not proof that real users improved.
Copy-paste example
<link rel="preconnect" href="https://cdn.example.com" crossorigin>
<link rel="preload" href="/fonts/brand.woff2" as="font"
      type="font/woff2" crossorigin>
<script src="/js/analytics.js" defer></script>
Evidence from our workflow
For every performance change we capture the URL, device profile, connection profile, FCP, TTFB, and the changed request. That evidence makes it possible to tell whether a faster FCP came from critical-path work or from a different test condition.
Primary sources
Editorial note: This guide was written by Robert Belkin, Founder & Lead Strategist at Page One Brand, and technically reviewed by Robert Belkin on August 25, 2026. See the author profile, scoring methodology, and contact page for supporting business and editorial information.