Core Web Vitals & Performance
Largest Contentful Paint (LCP): The Core Web Vital That Defines Perceived Load Speed
By Robert Belkin, Founder & Lead Strategist
Published · Reviewed by Robert Belkin · 7 min read
Largest Contentful Paint — LCP — is the point at which the largest piece of content in the viewport finishes rendering. It is the Core Web Vital most closely correlated with how fast a page feels to real users, and the one Google weighs most heavily in the page experience signal. Getting LCP right matters both for rankings and for the basic user experience of your site.
What LCP Measures and How It Is Calculated
LCP identifies the single largest content element visible in the viewport and records the time from navigation start to when that element finishes rendering. The element can be: an image, a video poster, a background image loaded via CSS, or a block-level text element. The browser updates its candidate LCP element as the page loads.
The thresholds: good is below 2.5 seconds, needs improvement is 2.5 to 4 seconds, and poor is above 4 seconds. These thresholds apply at the 75th percentile of your real user sessions — meaning 75% of your visitors should experience LCP below the target.
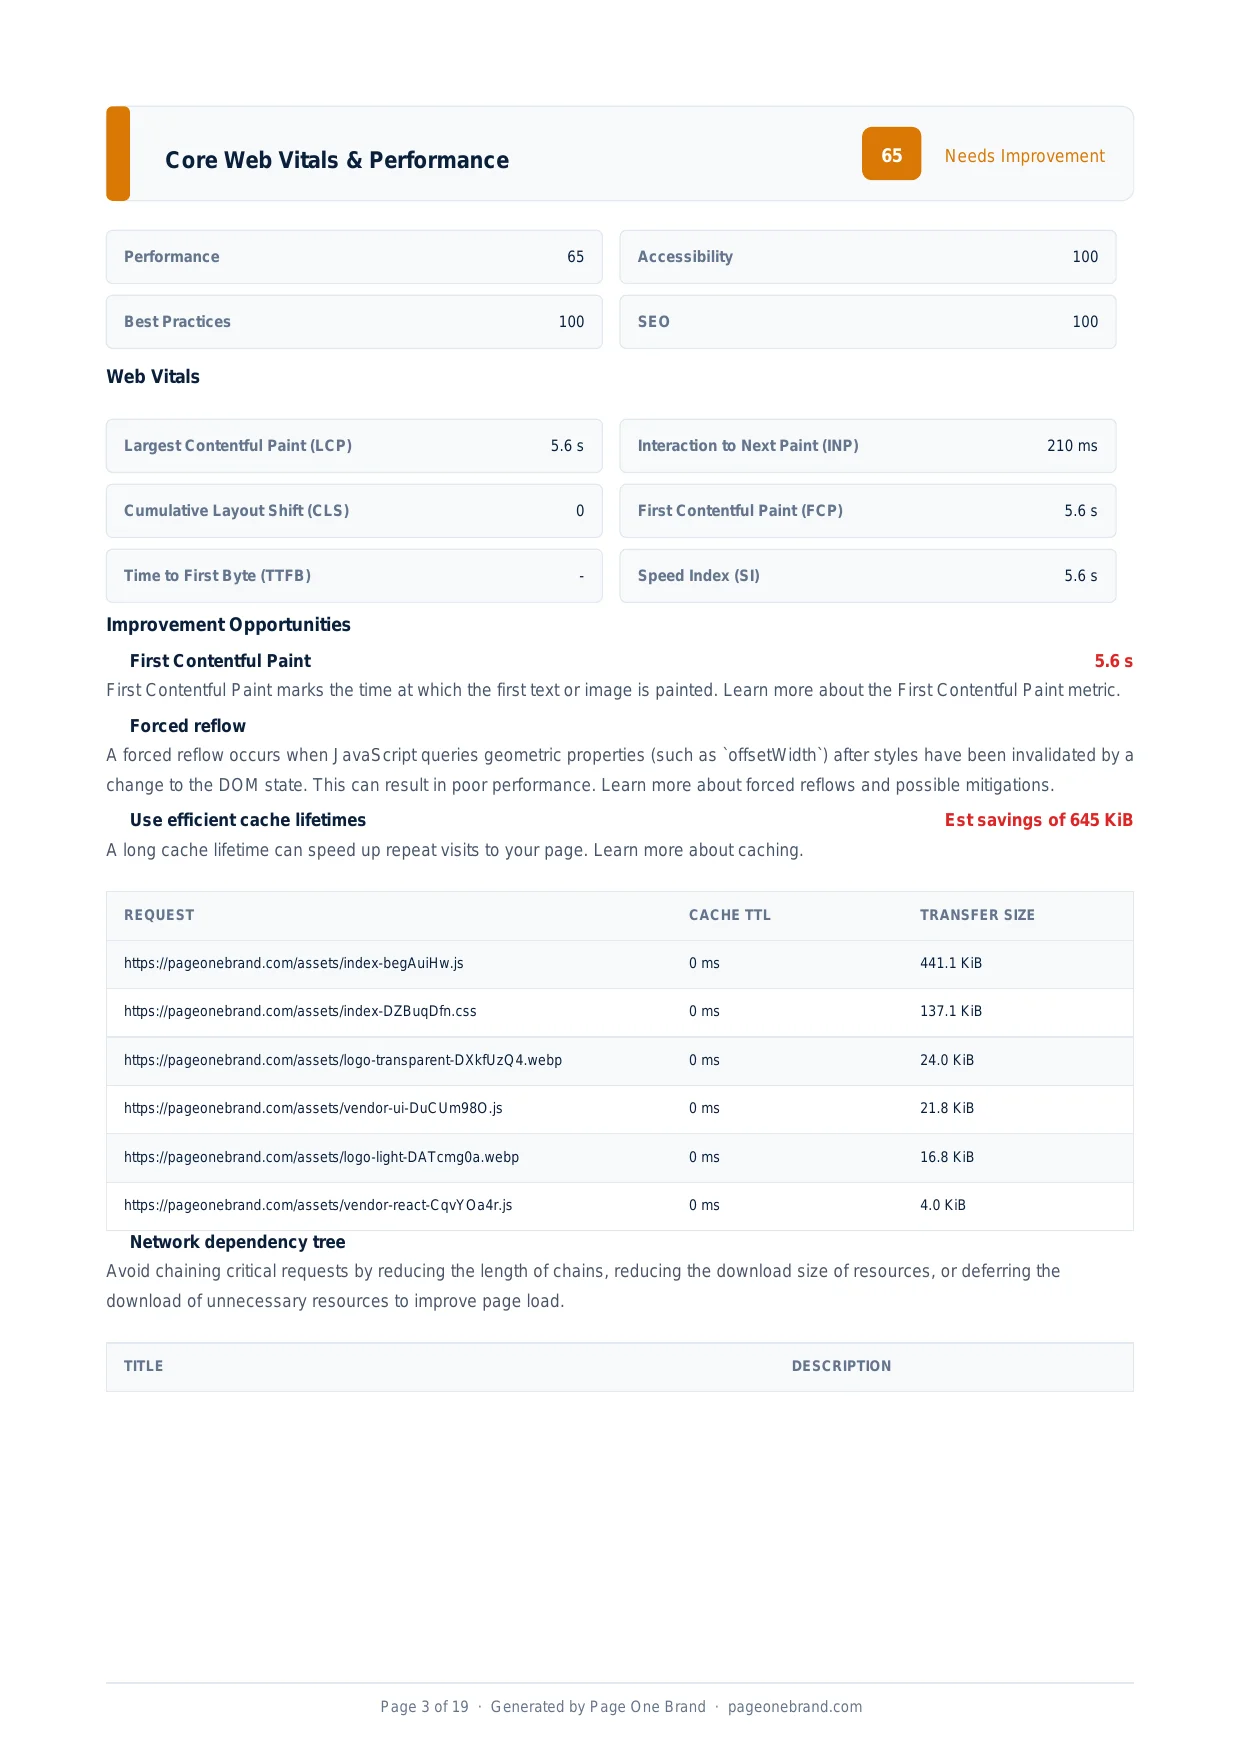
The Performance section of a Page Quality Analyzer report — LCP is the most impactful metric and appears alongside FCP and Speed Index in the vitals table.
The Four LCP Bottlenecks
Slow Time to First Byte (TTFB). LCP cannot complete until the browser has received the HTML document, discovered the LCP resource, and downloaded it. A slow TTFB cascades into a slow LCP. A CDN caches responses close to users and is typically the single highest-leverage fix for TTFB.
Render-blocking resources. Scripts and stylesheets that block the HTML parser delay when the browser discovers and begins loading the LCP resource. Every 100ms of render-blocking time is 100ms added to LCP. Inline your critical CSS, defer non-critical scripts, and add preconnect hints for third-party origins.
Slow LCP resource load time. If the LCP element is a large JPEG image, its download time directly adds to LCP. Serve the image in WebP or AVIF format (25 to 50% smaller than JPEG at equivalent quality), size it correctly for the container, use a CDN, and add a rel="preload" hint in the head so the browser starts downloading it immediately.
Client-side rendering. Frameworks that render content via JavaScript after the initial page load push LCP to whenever the JavaScript finishes executing. Server-side rendering or static generation of the above-the-fold content eliminates this bottleneck entirely.
Diagnosing Your LCP Element
Open Chrome DevTools, go to the Performance panel, and record a page load. In the Timings row, you will see an LCP marker. Click it to see which element was identified as the LCP candidate. Alternatively, run a Lighthouse audit and look at the "Largest Contentful Paint element" section in the Diagnostics panel.
Many sites assume their LCP element is the hero image, only to discover Lighthouse is flagging a large heading or a text block instead. If that is the case, the optimisation strategy shifts from image compression to server response time and render-blocking resource reduction.
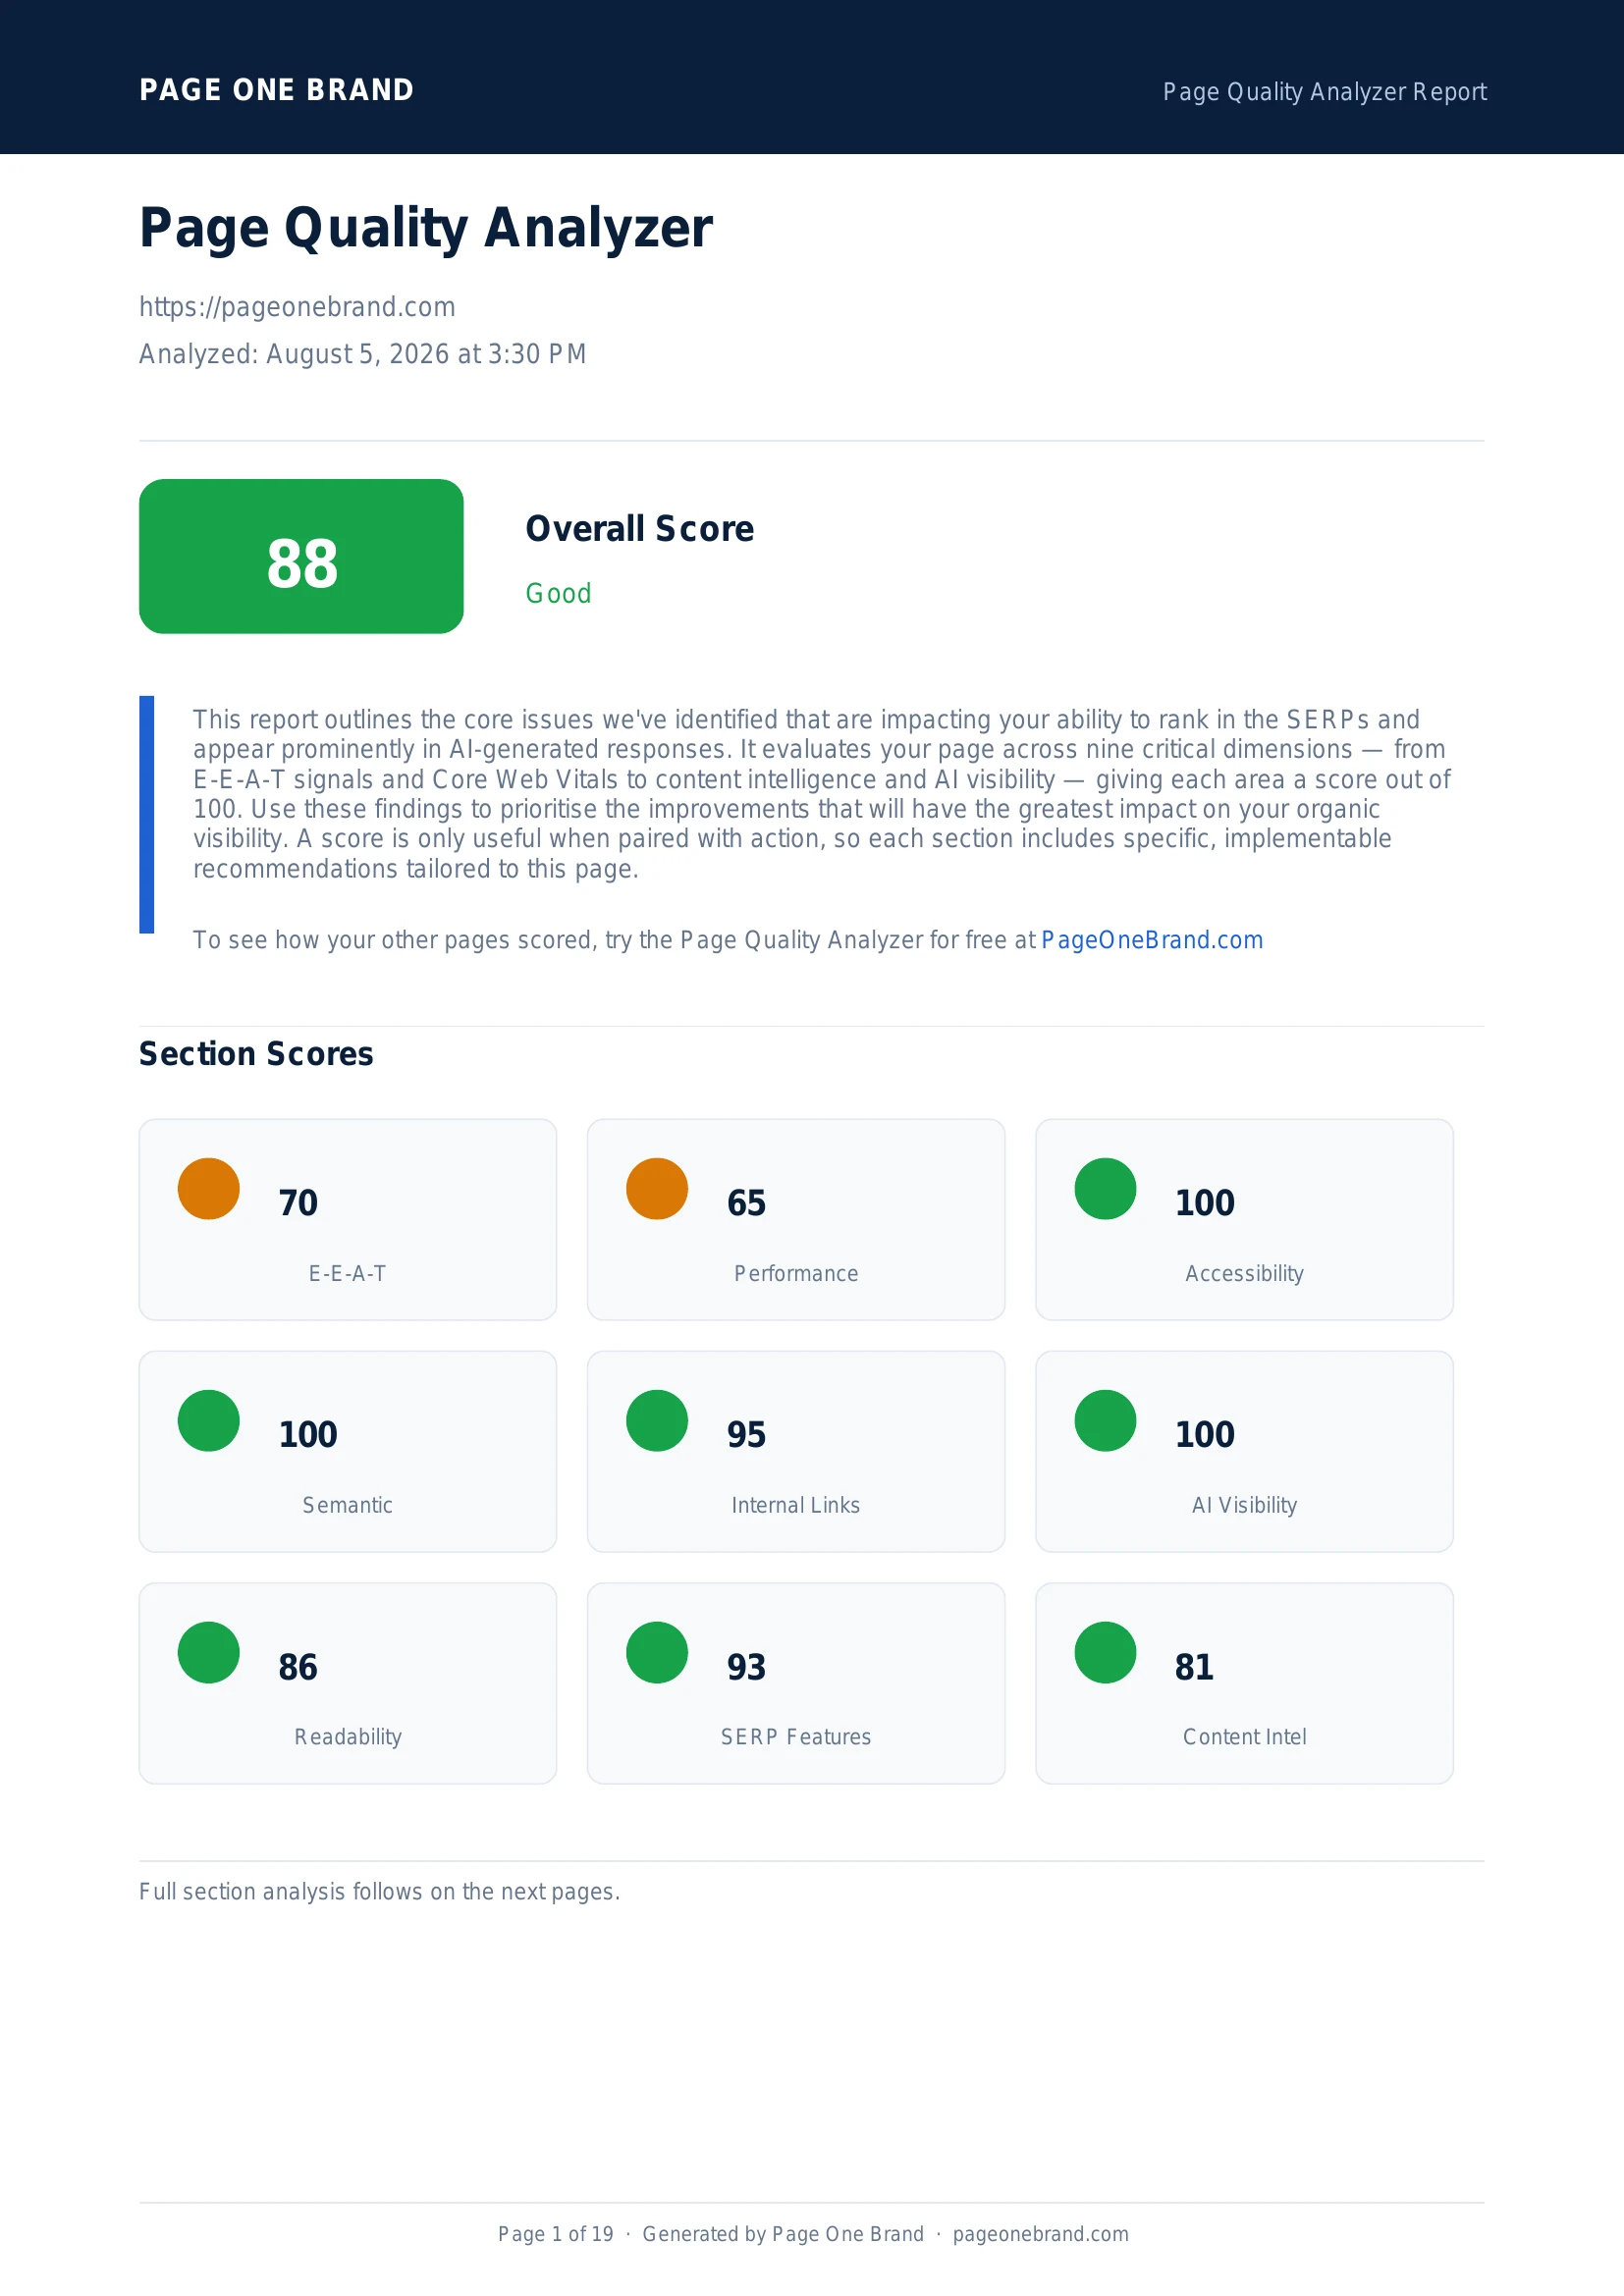 A full Page Quality Analyzer scan — LCP is one of the metrics that pulls the Performance score up or down most significantly.
The Highest-Impact LCP Fixes
If your LCP element is an image: add fetchpriority="high" to the img tag, add a matching rel="preload" link in the head, convert it to WebP or AVIF, and ensure it is served from a CDN. Remove loading="lazy" from the LCP image — lazy loading delays the LCP element.
If your LCP element is text: focus on server response time and eliminating render-blocking CSS. Text renders immediately once the browser has the HTML and the stylesheet — the bottleneck is almost always upstream of the text element itself.
After each fix, rerun the Page Quality Analyzer or a fresh Lighthouse test. LCP is measurable and responds quickly to targeted changes. The key is diagnosing the right bottleneck before writing any code.
LCP Element Types and Their Specific Optimisations
The correct fix for a slow LCP depends entirely on what element the browser identifies as the LCP candidate. Chrome DevTools and Lighthouse both identify the element — check before optimising.
| LCP Element Type | Common Example | Primary Fix | Secondary Fix |
|---|
| <img> element | Hero photograph, product image | Add fetchpriority="high" and rel="preload" | Convert to WebP/AVIF, serve from CDN |
| CSS background-image | Full-width banner with CSS background | Add <link rel="preload"> in <head> | Switch to <img> element for easier prioritisation |
| Block-level text (<p>, <h1>) | Large hero heading or intro paragraph | Reduce TTFB and eliminate render-blocking CSS | Preload the web font used by this element |
| <svg> element | Large inline logo or illustration | Inline small SVGs; use img for large ones | Simplify SVG path complexity to reduce parse time |
| <video> poster | Autoplay background video | Preload the poster image with rel="preload" | Consider a static image with play-on-click instead |
Understanding the 75th Percentile Requirement
Google measures Core Web Vitals at the 75th percentile of real user sessions collected by the Chrome User Experience Report (CrUX) over a rolling 28-day window. Passing the LCP threshold means that 75% of your real users must experience LCP below 2.5 seconds — but 25% can still experience a slow LCP and your site will still pass the assessment.
This has important implications for diagnosis. If your p75 LCP is 2.6s — just above the threshold — improving LCP for your median user will not necessarily move the p75. You need to understand your slowest quartile: mobile users on slow connections, users in distant geographic regions, and users with browser extensions. Use the CrUX API or the Chrome User Experience Report in BigQuery to segment your LCP distribution before prioritising fixes.
The HTTP Archive's Web Almanac consistently shows that mobile LCP median is around 3.3 seconds, well above the 2.5s Good threshold. Desktop median is typically around 1.8s — well within Good. This gap means mobile optimisation almost always moves the needle more than desktop optimisation for Core Web Vitals compliance.
LCP Optimisation Checklist
- Identify your LCP element. Run Lighthouse or open Chrome DevTools → Performance → record a load → find the LCP marker in the Timings row. Do not guess — act on the actual element.
- Add
fetchpriority="high" to the LCP image. This signals to the browser that this resource should be downloaded immediately, ahead of other images. It is the single highest-impact change for image-based LCP elements.
- Add a matching
<link rel="preload">. Preloading the LCP image starts the download before the browser encounters the <img> tag in the HTML.
- Remove
loading="lazy" from the LCP image. Lazy loading intentionally delays image download. On the LCP element, this directly increases LCP time.
- Serve images in WebP or AVIF format. WebP reduces file size 25–34% vs JPEG at equivalent visual quality. AVIF reduces it a further 20–30% vs WebP. Smaller files download faster on all connections.
- Place the LCP image on a CDN. A content delivery network serves the image from a node geographically close to the user, reducing download latency to tens of milliseconds rather than hundreds.
- Reduce TTFB below 800ms. Every millisecond of TTFB is a millisecond added to LCP. Server-side caching, CDN edge caching, and database query optimisation are the standard levers.
- Eliminate render-blocking resources. Scripts and stylesheets that block the HTML parser delay when the browser discovers and begins loading the LCP resource.
Frequently Asked Questions About Largest Contentful Paint
Why is my LCP different in Lighthouse versus Google Search Console?
Lighthouse reports lab data — a single synthetic measurement under controlled conditions (simulated mid-range Android, throttled 4G connection). Google Search Console reports field data from the Chrome User Experience Report (CrUX): real measurements from real Chrome users over a 28-day rolling window, aggregated at the 75th percentile. They measure different things. A Lighthouse LCP of 1.8s with a Search Console LCP of 3.5s indicates your real users (likely more mobile, on slower connections, or geographically distant from your server) have a significantly different experience than the lab simulation.
Can LCP be faster than FCP?
No. LCP cannot be faster than FCP because the browser must paint something before it can identify the largest painted element. On some pages, FCP and LCP are very close — the first thing the browser paints is also the largest element. On others, the LCP element loads after several other content pieces have already appeared. The gap between FCP and LCP represents how long users see partial content before the main content element finishes loading.
What is fetchpriority="high" and when should I use it?
The fetchpriority attribute (also available as the importance attribute in older implementations) tells the browser's preload scanner to prioritise this resource over other resources of the same type. Set it to "high" on the LCP image element. The browser will deprioritise other images and download the LCP image first. According to web.dev, adding fetchpriority="high" to the LCP image can improve LCP by 5–10% on pages with multiple image resources competing for bandwidth.
Why does removing loading="lazy" from my hero image improve LCP?
The loading="lazy" attribute tells the browser to defer downloading an image until it is near the viewport. This is appropriate for images below the fold. However, when applied to the LCP element — which is by definition in the initial viewport — it forces the browser to delay the download unnecessarily. The browser's preload scanner cannot discover a lazy-loaded image ahead of time, so the download does not begin until the HTML parser reaches the <img> tag. Removing loading="lazy" from the LCP image allows the preload scanner to discover and download it immediately.
Step-by-Step: Diagnosing Your LCP Resource with Chrome DevTools
Before writing a line of code, identify the exact LCP element and its bottleneck. Chrome DevTools gives you everything you need in two minutes.
- Open DevTools and go to the Performance panel. Check "Screenshots" and "Web Vitals" in the toolbar, then click Record and reload the page.
- Find the LCP marker. In the Timings row at the top of the flame chart, click the "LCP" marker. The Summary panel at the bottom shows which element was identified as the LCP candidate — its tag, ID, and a screenshot of the viewport at that moment.
- Check the LCP attribution breakdown. Chrome DevTools (and the PageSpeed Insights lab report) breaks LCP into four sub-parts: TTFB → resource load delay → resource load time → element render delay. The longest sub-part is your bottleneck.
- For image LCP elements: look at the waterfall. Find the image request in the Network panel. A long TTFB on the image means your CDN is missing or misconfigured. A long download time means the file is too large. A delayed start means the preload scanner didn't discover the image early enough.
- For text LCP elements: focus on TTFB and blocking CSS. Text renders as soon as the HTML and stylesheet are available. A slow text LCP almost always traces back to a slow server response or a render-blocking stylesheet preventing the browser from displaying the text.
The four LCP sub-parts and their fixes at a glance:
| Sub-part | What it measures | Primary fix |
|---|
| TTFB | Time until the first byte of HTML arrives | CDN, server-side caching, database query optimisation |
| Resource load delay | Time from TTFB to when the LCP resource starts downloading | Add <link rel="preload"> and fetchpriority="high" to start download earlier |
| Resource load time | Time to fully download the LCP resource | Convert to WebP/AVIF, reduce file size, serve from CDN |
| Element render delay | Time from resource downloaded to element painted | Eliminate render-blocking CSS; inline critical styles |
Image Optimisation for LCP: WebP, AVIF, srcset, and sizes
If your LCP element is an image, file size is the most direct lever on resource load time. Three changes consistently produce the largest reductions:
1. Convert to WebP or AVIF. WebP reduces file size 25–34% vs JPEG at equivalent visual quality. AVIF reduces it a further 20–30% vs WebP. Use the <picture> element to serve AVIF to browsers that support it and WebP as a fallback:
<picture>
  <source srcset="/hero.avif" type="image/avif">
  <source srcset="/hero.webp" type="image/webp">
  <img src="/hero.jpg" alt="Hero image description"
       fetchpriority="high" width="1200" height="600">
</picture>
2. Use srcset and sizes for responsive images. A 1200px image served on a 390px mobile screen is three times larger than necessary. The srcset attribute lets the browser choose the right size for the current viewport:
<img
  src="/hero-800.webp"
  srcset="/hero-400.webp 400w, /hero-800.webp 800w, /hero-1200.webp 1200w"
  sizes="(max-width: 640px) 100vw, (max-width: 1024px) 80vw, 1200px"
  fetchpriority="high"
  alt="Hero image description"
  width="1200" height="600">
3. Preload the LCP image in the document head. The browser's preload scanner discovers images when it reaches the <img> tag in the HTML. A <link rel="preload"> in the <head> starts the download immediately — before the parser reaches the image tag — reducing resource load delay to near zero:
<!-- In <head>, before any stylesheets if possible -->
<link rel="preload" as="image"
      href="/hero-800.webp"
      imagesrcset="/hero-400.webp 400w, /hero-800.webp 800w, /hero-1200.webp 1200w"
      imagesizes="(max-width: 640px) 100vw, 800px">
Before and After: Real LCP Improvements
The following examples show representative LCP gains from the optimisations described in this guide.
| Site type | Before | After | Primary fix |
|---|
| E-commerce hero image (1.8 MB JPEG, no CDN) | 5.8 s LCP | 1.9 s LCP | Converted to WebP (280 KB); added CDN; added fetchpriority="high" |
| Blog with text LCP (slow shared hosting) | 4.1 s LCP | 1.7 s LCP | Migrated to CDN-fronted hosting; TTFB fell from 3.2 s to 0.3 s |
| React SPA (hero image discovered late) | 6.3 s LCP | 2.1 s LCP | Added preload hint; removed lazy loading from LCP img; switched to SSR |
| Marketing page with render-blocking CSS | 3.9 s LCP | 2.2 s LCP | Inlined critical CSS; deferred non-critical stylesheets |
LCP, INP, and CLS: How the Three Core Web Vitals Interact
LCP is the most heavily weighted Core Web Vital in Lighthouse (25%), but it is only one of three that Google measures in the field via CrUX. Understanding how the three interact prevents fixing one while inadvertently breaking another.
- LCP and CLS often share a root cause. Images without explicit
width and height attributes cause the browser to allocate no space for them during layout, then shift content when the image loads. This simultaneously raises CLS (content shifts) and slows LCP (the image may load late). Adding width and height attributes to the LCP image and all above-the-fold images reduces both metrics.
- LCP and INP fixes can conflict. Preloading large JavaScript bundles to speed up interactivity (INP) can compete with the LCP image for bandwidth. Prioritise the LCP image with
fetchpriority="high" and load JavaScript with defer to avoid the conflict.
- TTFB affects all three. A slow server response delays when the browser starts loading any resource — images, stylesheets, scripts. A TTFB above 800ms is a systemic bottleneck that will drag down LCP, FCP, and can worsen CLS (as fonts and images load late, causing shifts). Fix TTFB first.
The INP threshold is 200ms (Good) / 500ms (Poor). If your site passes LCP and CLS but fails INP, the cause is almost always JavaScript blocking the main thread — large bundles, unoptimised third-party scripts, or synchronous event handlers running expensive operations. These require separate investigation from LCP root-cause analysis.
Editorial implementation brief · Performance
LCP optimisation starts with the element, not the score
An LCP number is the outcome of resource-load delay, resource-load duration, and render delay. Identify the actual element and the slowest subpart before changing priorities.
What to check, in order
- Use DevTools or PageSpeed Insights to name the LCP element at the failing viewport.
- If it is an image, put it in the initial HTML, remove
loading="lazy", and consider fetchpriority="high". - Preload only the LCP resource when discovery is genuinely late; unused preloads waste bandwidth.
- Reduce TTFB and render-blocking work when the LCP resource is available but the element paints late.
- Validate the result in field data because Lighthouse and CrUX answer different questions.
Copy-paste example
<link rel="preload" as="image" href="/hero.avif" type="image/avif">
<img src="/hero.avif" width="1280" height="720"
     fetchpriority="high" alt="Product dashboard">
Evidence from our workflow
We record the LCP element selector, URL, request priority, and the three timing subparts before and after a change. If the element changes, we report that explicitly rather than comparing two different LCP candidates as if they were the same.
Primary sources
Editorial note: This guide was written by Robert Belkin, Founder & Lead Strategist at Page One Brand, and technically reviewed by Robert Belkin on August 25, 2026. See the author profile, scoring methodology, and contact page for supporting business and editorial information.