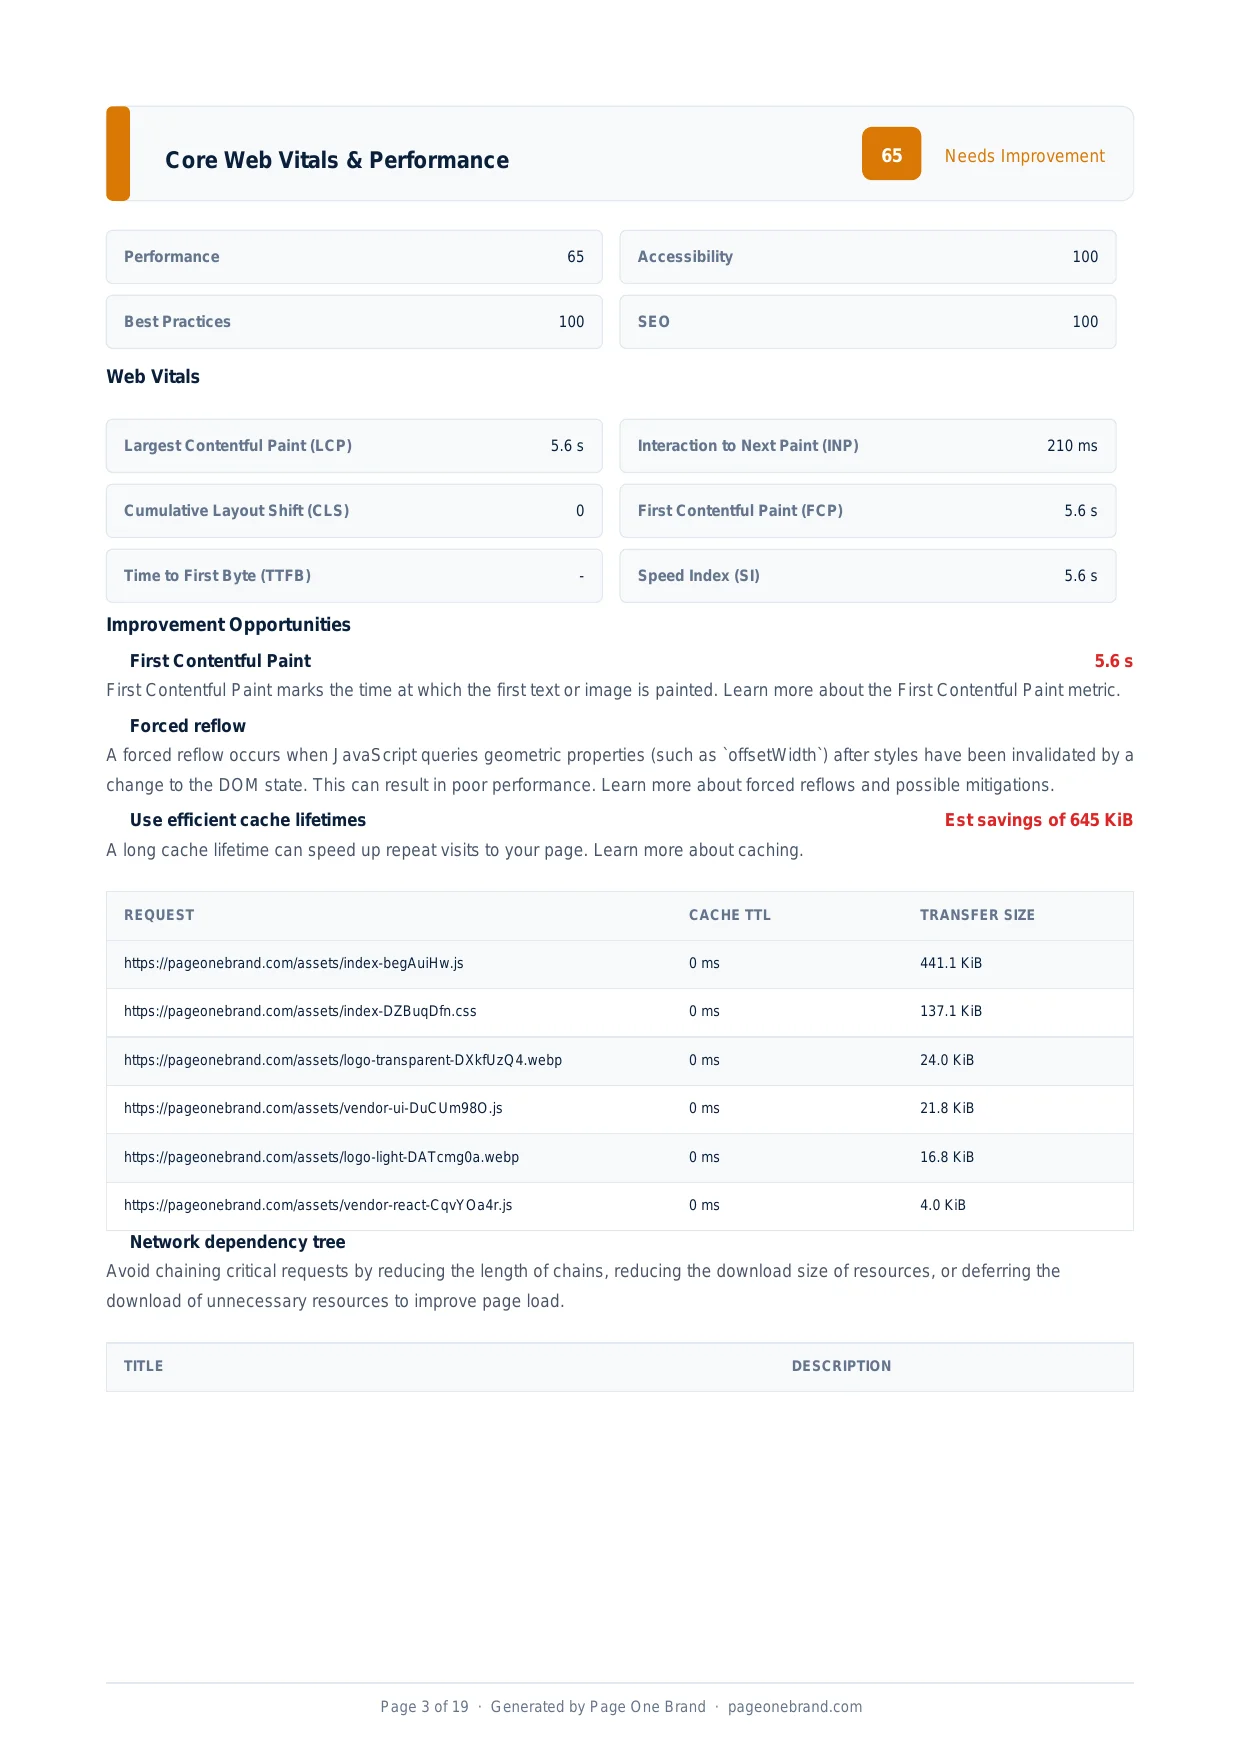
Core Web Vitals & Performance
How to Minimize Main-Thread Work and Stop JavaScript from Blocking Your Page
By Robert Belkin, Founder & Lead Strategist
Published · Reviewed by Robert Belkin · 6 min read
The browser's main thread is a single-lane road. Everything that makes your page work — parsing HTML and CSS, executing JavaScript, calculating layout, painting pixels, and responding to user events — shares that one lane. When a long JavaScript task occupies the lane, everything else queues behind it. Minimising main-thread work is about keeping that lane clear.
What the Main Thread Actually Does
Lighthouse breaks down main-thread time into categories. Understanding each tells you where to focus:
Script Evaluation — Time spent parsing, compiling, and executing JavaScript. Usually the largest category and the most impactful to reduce. Large bundles, many small files, and expensive function calls all contribute here.
Style and Layout — Time calculating which CSS rules apply to which elements and computing the size and position of every element. Particularly expensive when triggered repeatedly in a loop.
Rendering — The paint and composite phases. Animations that affect layout properties (width, height, top, left) trigger repaint on every frame. Animations using transform and opacity run on the compositor thread instead — avoiding main-thread cost entirely.
Script Parsing and Compilation — The initial parse phase that turns source text into executable code. Reducing JavaScript file size directly reduces this time.
The Minimize Main-Thread Work opportunity shows the breakdown by category — Script Evaluation, Style and Layout, Rendering — so you can target the biggest bottleneck.
The 50ms Rule: What Makes a Long Task
The browser considers any task that takes longer than 50ms a long task. During a long task, user input events are queued and cannot be processed until the task completes. This is why pages can look interactive while still feeling unresponsive: the main thread is occupied, and the browser ignores everything the user does until it is done.
The Max Potential First Input Delay metric is the duration of the single longest task. If your longest task is 400ms, a user who clicks during that window will wait up to 400ms for a response.
How to Reduce Main-Thread Work
Reduce JavaScript bundle size. Less JavaScript means less parse, compile, and execute time. Tree shaking, code splitting, and removing unused dependencies directly reduce Script Evaluation time. A bundle that is 200 KiB instead of 500 KiB will execute in roughly 40% of the time.
Break up long tasks. A 400ms synchronous function is a 400ms long task. The same work split into four 100ms chunks with setTimeout(fn, 0) or scheduler.yield() between them gives the browser three opportunities to process input events during the computation.
Move work to a Web Worker. Web Workers run JavaScript on a background thread, separate from the main thread. Data parsing, sorting, filtering, image processing, and other CPU-intensive computations that do not need direct DOM access are good candidates. The main thread stays free for rendering and input handling while the Worker computes.
Use CSS animations instead of JavaScript animations. Animations that change transform and opacity via CSS run on the compositor thread. Animations that change width, height, top, or left force main-thread layout recalculation on every frame.
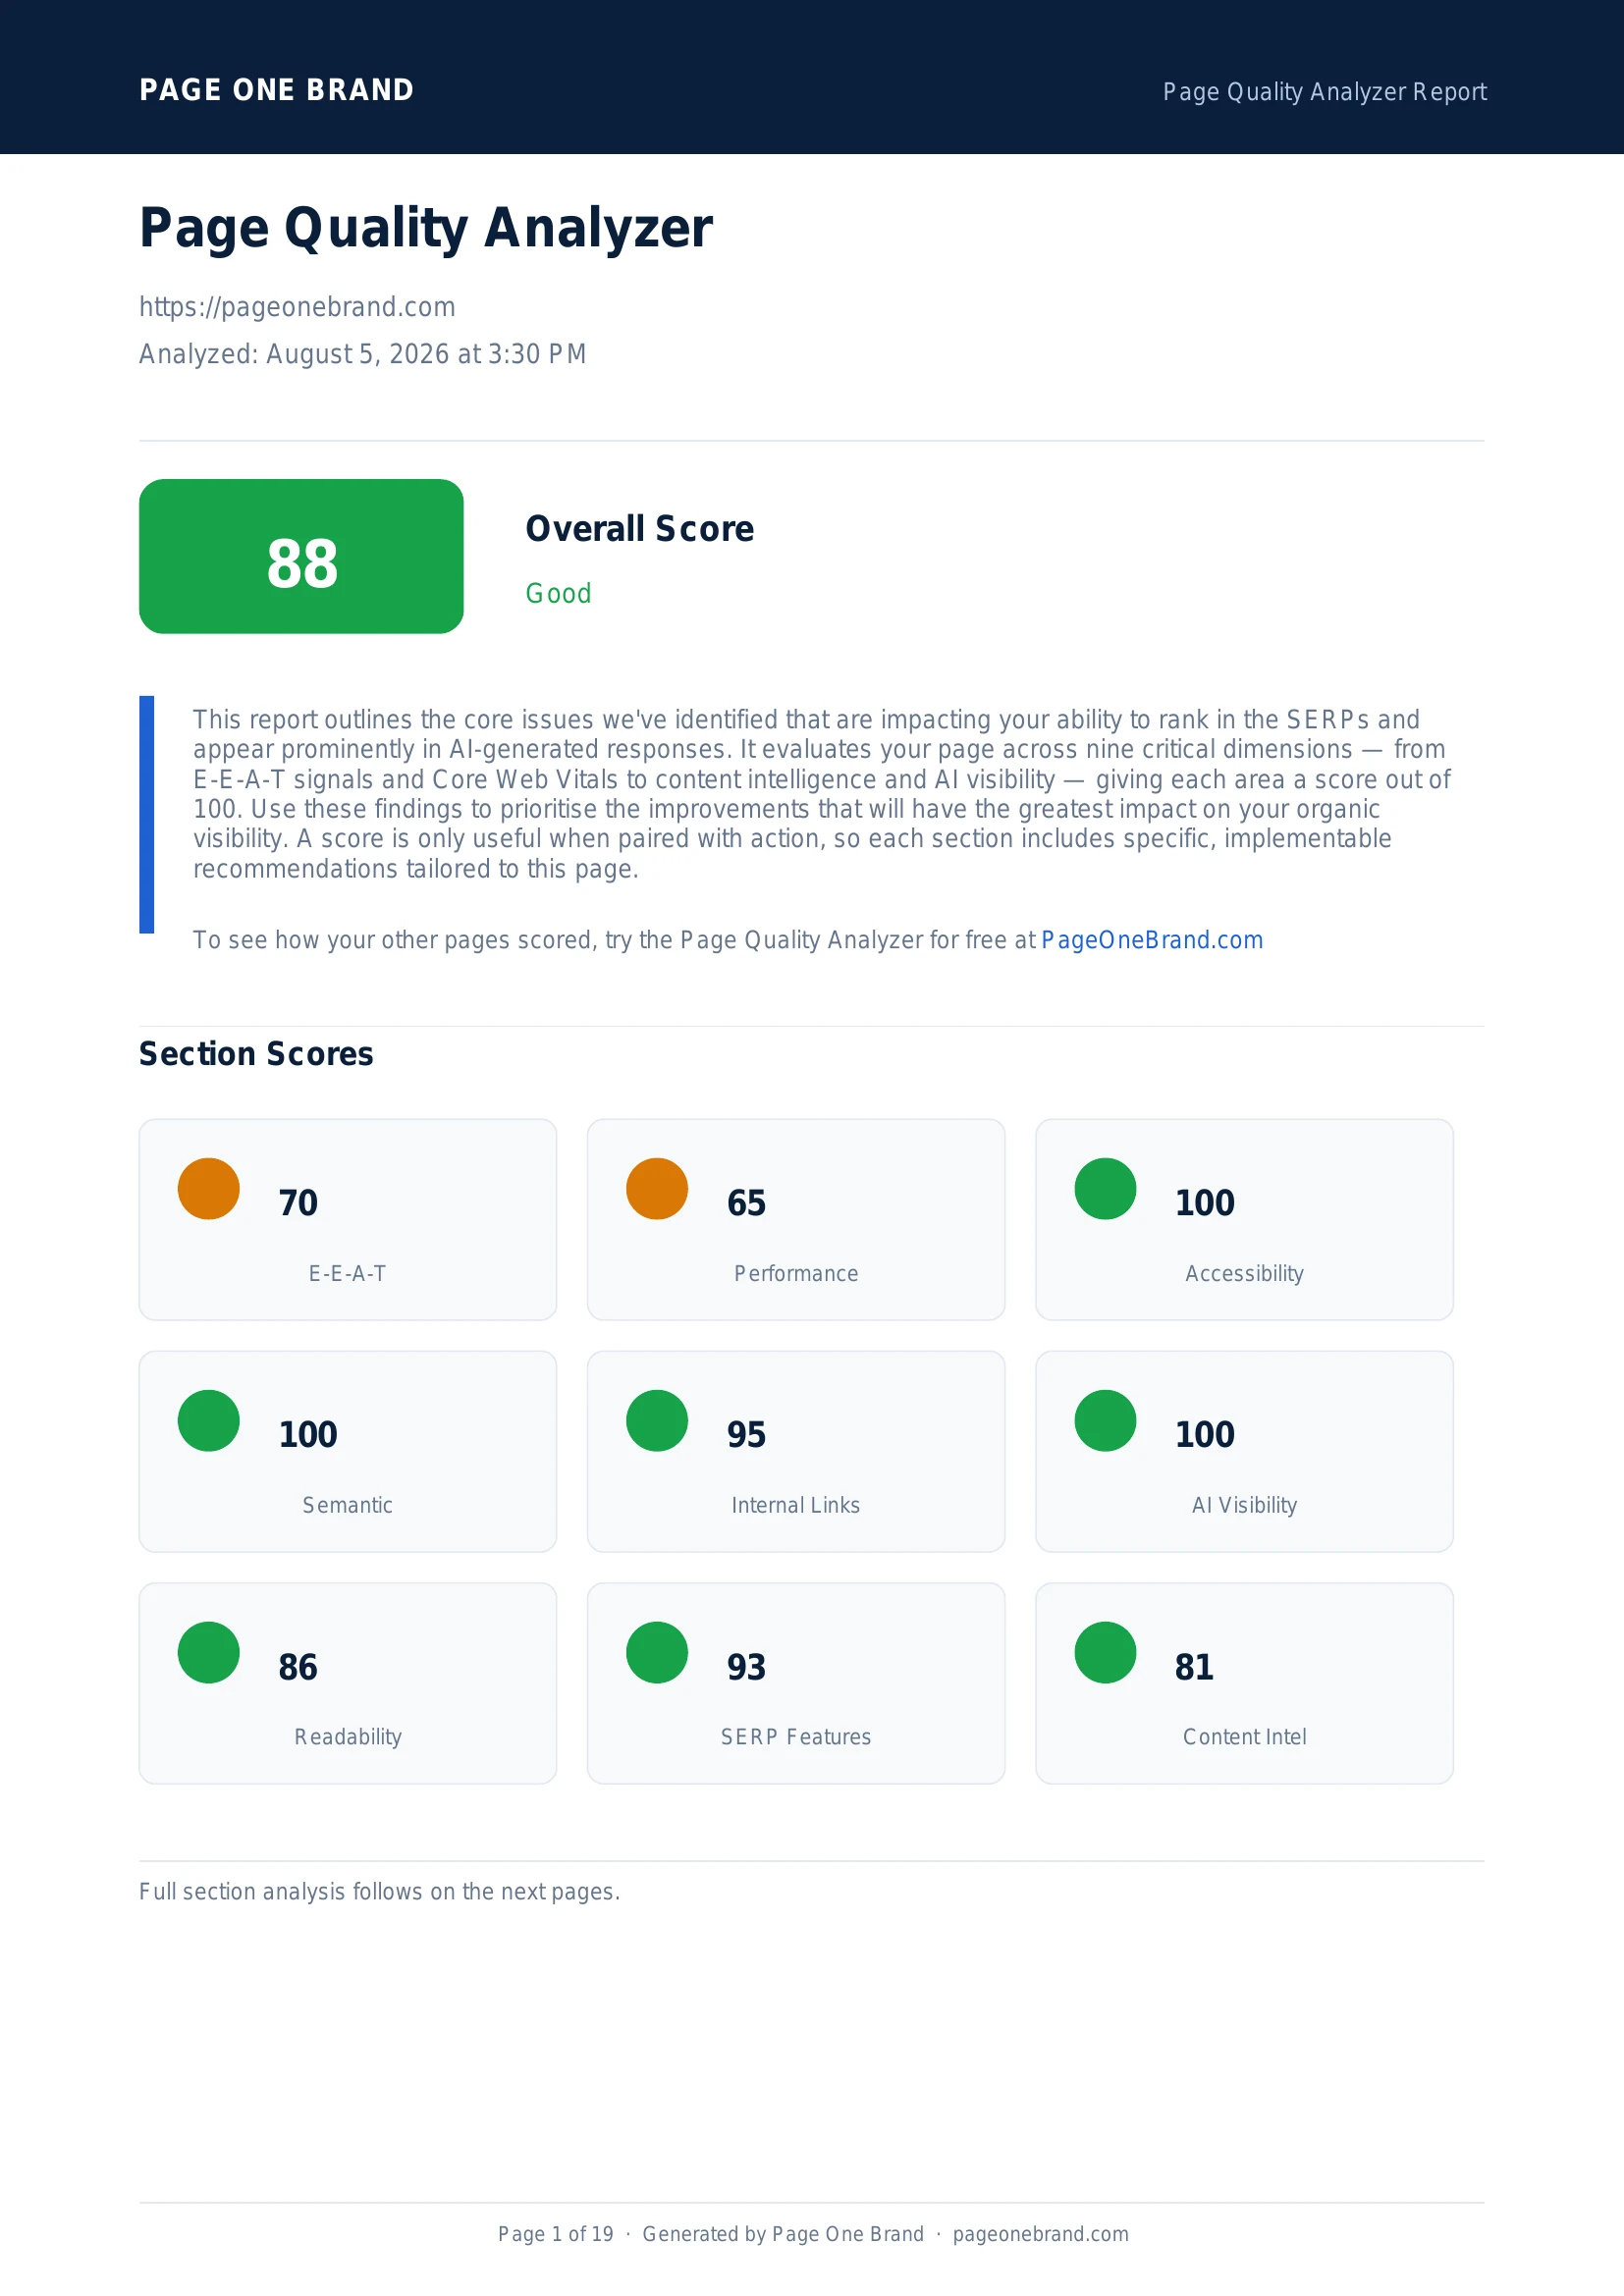 Main-thread work reduction improves Performance score, TTI, Max Potential FID, and INP simultaneously — it is foundational to page speed.
Measuring and Monitoring
Chrome DevTools Performance panel is the best tool for diagnosing main-thread work. Record a page load, then look at the main thread timeline. Long tasks appear as red-bordered blocks. Click any block to see the call stack that caused the task.
The Lighthouse audit gives you a total time and a per-category breakdown. Use the category breakdown to prioritise: if 80% of main-thread time is Script Evaluation, your focus is JavaScript reduction. If it is Style and Layout, look for layout thrashing in your code.
After each change, re-run the Page Quality Analyzer to track progress. Main-thread work reduction has a compounding effect — less JavaScript means faster parse, faster execution, less layout triggered by component renders, and a cleaner path to interactivity for every user.
Frequently Asked Questions About Main-Thread Work
What counts as a long task on the browser's main thread?
The browser classifies any task that takes longer than 50ms as a long task. During a long task, user input events are queued and cannot be processed until the task completes — this is why pages can look interactive while still feeling unresponsive. The Max Potential First Input Delay metric is the duration of the single longest task: a longest task of 400ms means a user who clicks during that window could wait up to 400ms for a response. Total Blocking Time (TBT) — the sum of the time beyond 50ms for all long tasks during load — accounts for 30% of the Lighthouse Performance score.
How do Web Workers help reduce main-thread work?
Web Workers run JavaScript in a background thread, entirely separate from the main thread. Work offloaded to a Worker does not contribute to long tasks on the main thread and does not block rendering or input handling. Good candidates for Worker offloading include data parsing and transformation, image processing, sorting and filtering large datasets, and cryptographic operations. The main thread stays free for rendering and responding to user input while the Worker computes. Workers cannot directly access the DOM, so tasks that require DOM manipulation must stay on the main thread — but the computation that feeds those DOM updates can be offloaded.
Why are CSS animations on transform and opacity more efficient than on layout properties?
Animations that change transform and opacity run on the compositor thread — a separate thread from the main thread — without triggering layout recalculation. The GPU handles these animations entirely, leaving the main thread free. Animations that change layout properties like width, height, top, left, or margin force a layout recalculation on every animation frame, which happens on the main thread. On a 60fps animation, that means 60 layout calculations per second. Switching from animating left to animating transform: translateX() produces identical visual movement with zero main-thread cost.
How do I find which JavaScript is responsible for most of my main-thread work?
Chrome DevTools Performance panel is the primary tool. Record a page load, then examine the main thread timeline: long tasks appear as blocks extending past the 50ms mark and are outlined in red. Click any block to see the call stack that produced it. The Lighthouse audit gives you a category breakdown — Script Evaluation, Style and Layout, Rendering, Script Parsing — which tells you which category to focus on. If 80% of main-thread time is Script Evaluation, the problem is JavaScript volume; if it is Style and Layout, look for forced reflows or expensive CSS recalculations. Fix the largest category first for the most impact per effort.
Editorial implementation brief · Performance
A main-thread budget you can profile
The browser’s main thread is shared by parsing, JavaScript, style, layout, paint, and input. Reduce the work that matters to the current route before reaching for a framework-wide rewrite.
What to check, in order
- Capture a trace and group time into scripting, rendering, painting, and loading.
- Remove route code that is not needed for the initial view with code splitting and dynamic imports.
- Break up long tasks and move CPU-heavy, independent computation to a Web Worker.
- Prefer transform and opacity for animation; avoid repeatedly forcing layout from scroll handlers.
- Re-run the same trace and compare total blocking time, long-task count, and interaction latency.
Copy-paste example
const chart = await import("./chart.js"); // load on demand
const worker = new Worker(new URL("./parse.worker.js", import.meta.url), {
  type: "module",
});
worker.postMessage(rawData);
Evidence from our workflow
Our performance notes preserve the trace category totals and the route interaction that generated them. A lower JavaScript byte count is not enough evidence if parsing, layout, or painting moved elsewhere and the interaction still blocks.
Primary sources
Editorial note: This guide was written by Robert Belkin, Founder & Lead Strategist at Page One Brand, and technically reviewed by Robert Belkin on August 25, 2026. See the author profile, scoring methodology, and contact page for supporting business and editorial information.