Core Web Vitals & Performance
Speed Index: How Google Measures Whether Your Page Fills In Fast Enough
By Robert Belkin, Founder & Lead Strategist
Published · Reviewed by Robert Belkin · 6 min read
Speed Index is a performance metric that measures how quickly the visible content of a page is visually populated. Unlike First Contentful Paint (which fires when anything first appears) or Largest Contentful Paint (which fires when the biggest element finishes), Speed Index tracks the whole journey — how fast the page goes from blank to fully visible. A page that renders progressively scores much better than one that stays blank and then appears all at once.
How Speed Index Is Calculated
Lighthouse captures a video of the page loading and analyses each frame to determine what percentage of the above-the-fold viewport is visually complete. Speed Index is then calculated as the area above the visual completeness curve — the integral over time of how much of the page is not yet visible. A lower number means the page filled in faster.
Google's thresholds: good is below 3.4 seconds, needs improvement is 3.4 to 5.8 seconds, and poor is above 5.8 seconds. Because Speed Index is area-under-the-curve rather than a single timestamp, it rewards pages that render progressively. A page that shows 30% of content at 1s, 70% at 2s, and 100% at 3s will score better than a page that shows 0% until 3s — even if both complete at the same time.
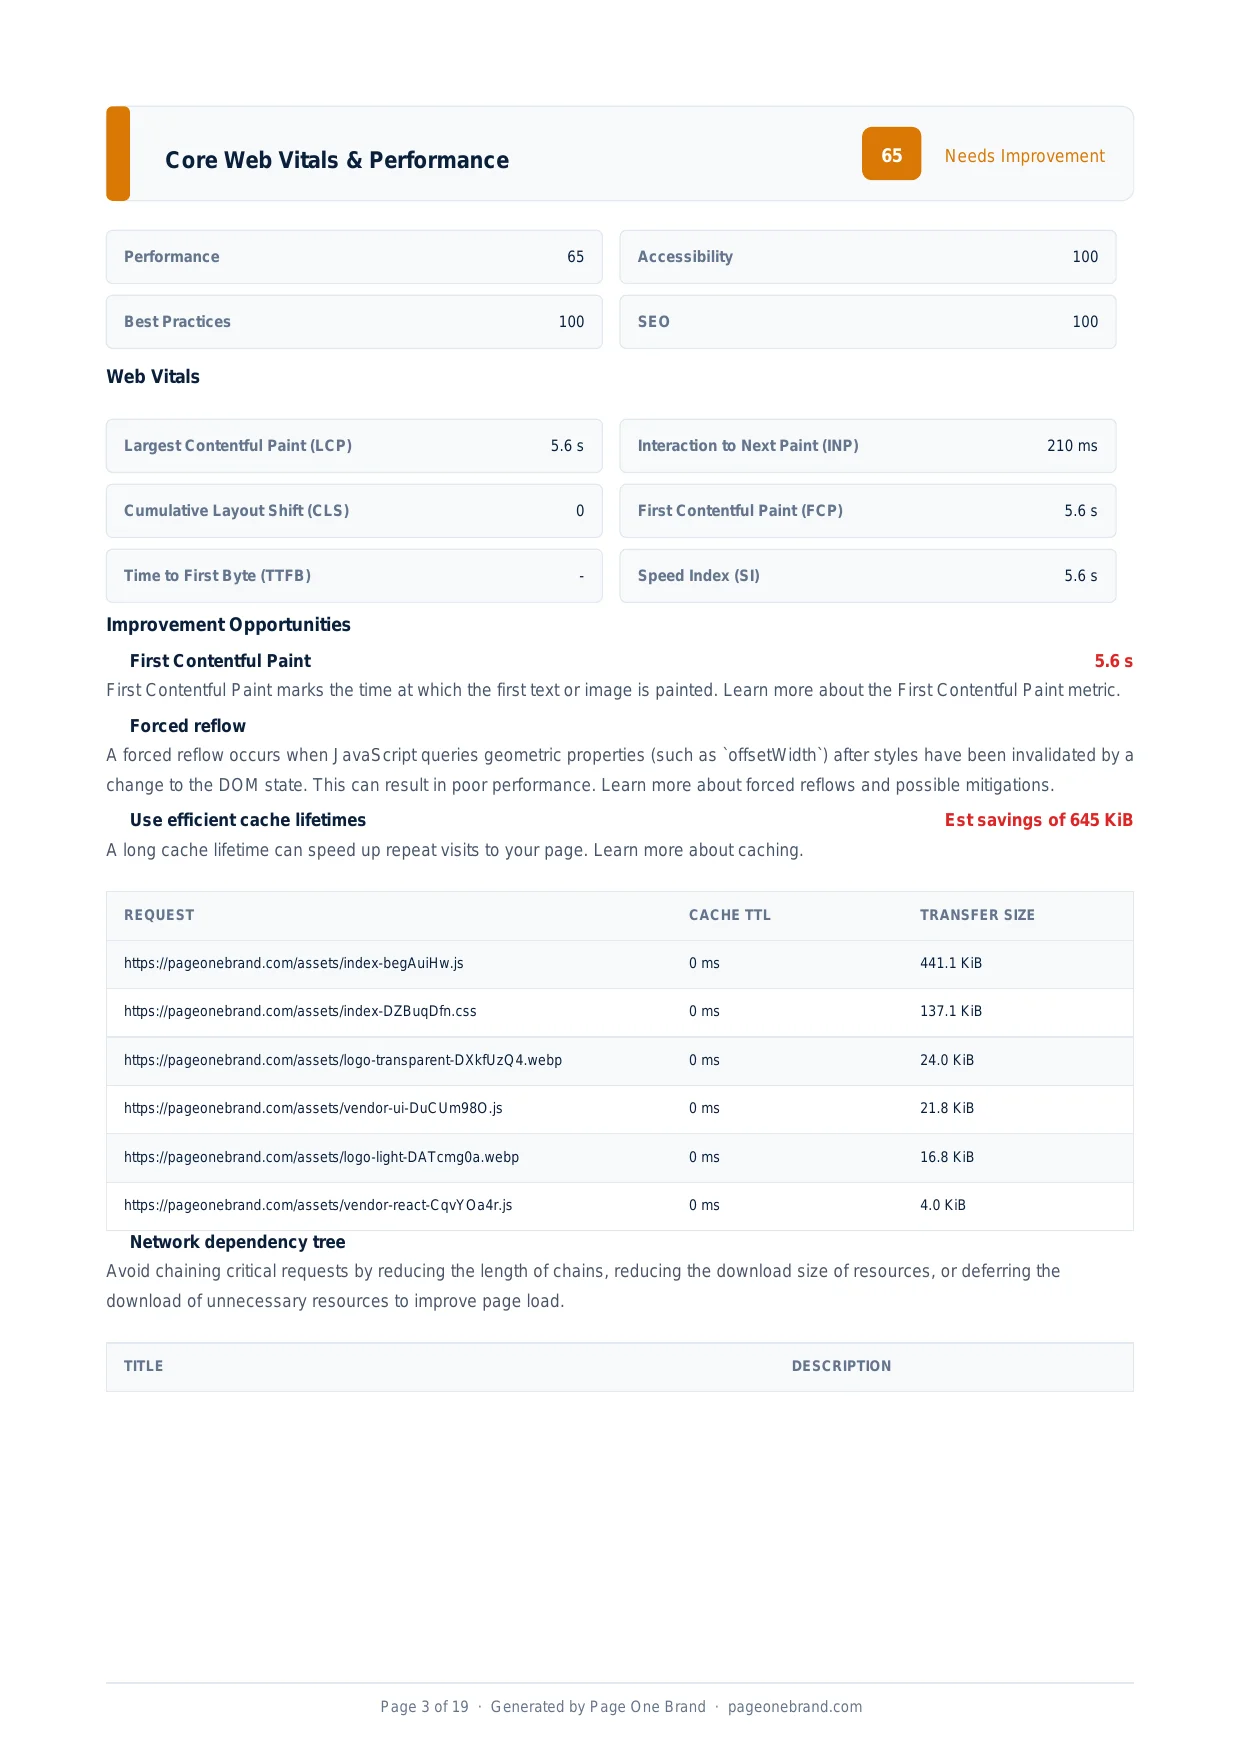
The Performance section of a Page Quality Analyzer report — Speed Index rewards progressive rendering, not just a fast final load time.
What Causes a Slow Speed Index
Render-blocking resources. Any CSS file or synchronous script that must be processed before the browser can paint anything keeps the page at 0% visual completeness during its download. Since Speed Index penalises long blank periods heavily, a single render-blocking stylesheet that takes 800ms to download has an outsized effect on the score.
Client-side rendering gaps. Single-page applications that ship an empty HTML shell will typically have a poor Speed Index because the page is blank until JavaScript executes. Server-side rendering or static generation transforms the curve from a step function to a gradual fill.
Third-party resources in the critical path. Web fonts loaded without font-display: swap or optional, images without proper dimensions (causing layout shifts), and scripts that must execute before any paint occurs all delay the start of visible rendering.
Speed Index vs FCP and LCP
A page can have a fast FCP but a slow Speed Index. This typically happens when the page shows a loading spinner or skeleton immediately (fast FCP) but the real content loads slowly (slow Speed Index). Addressing this requires optimising the content loading — not just showing something earlier.
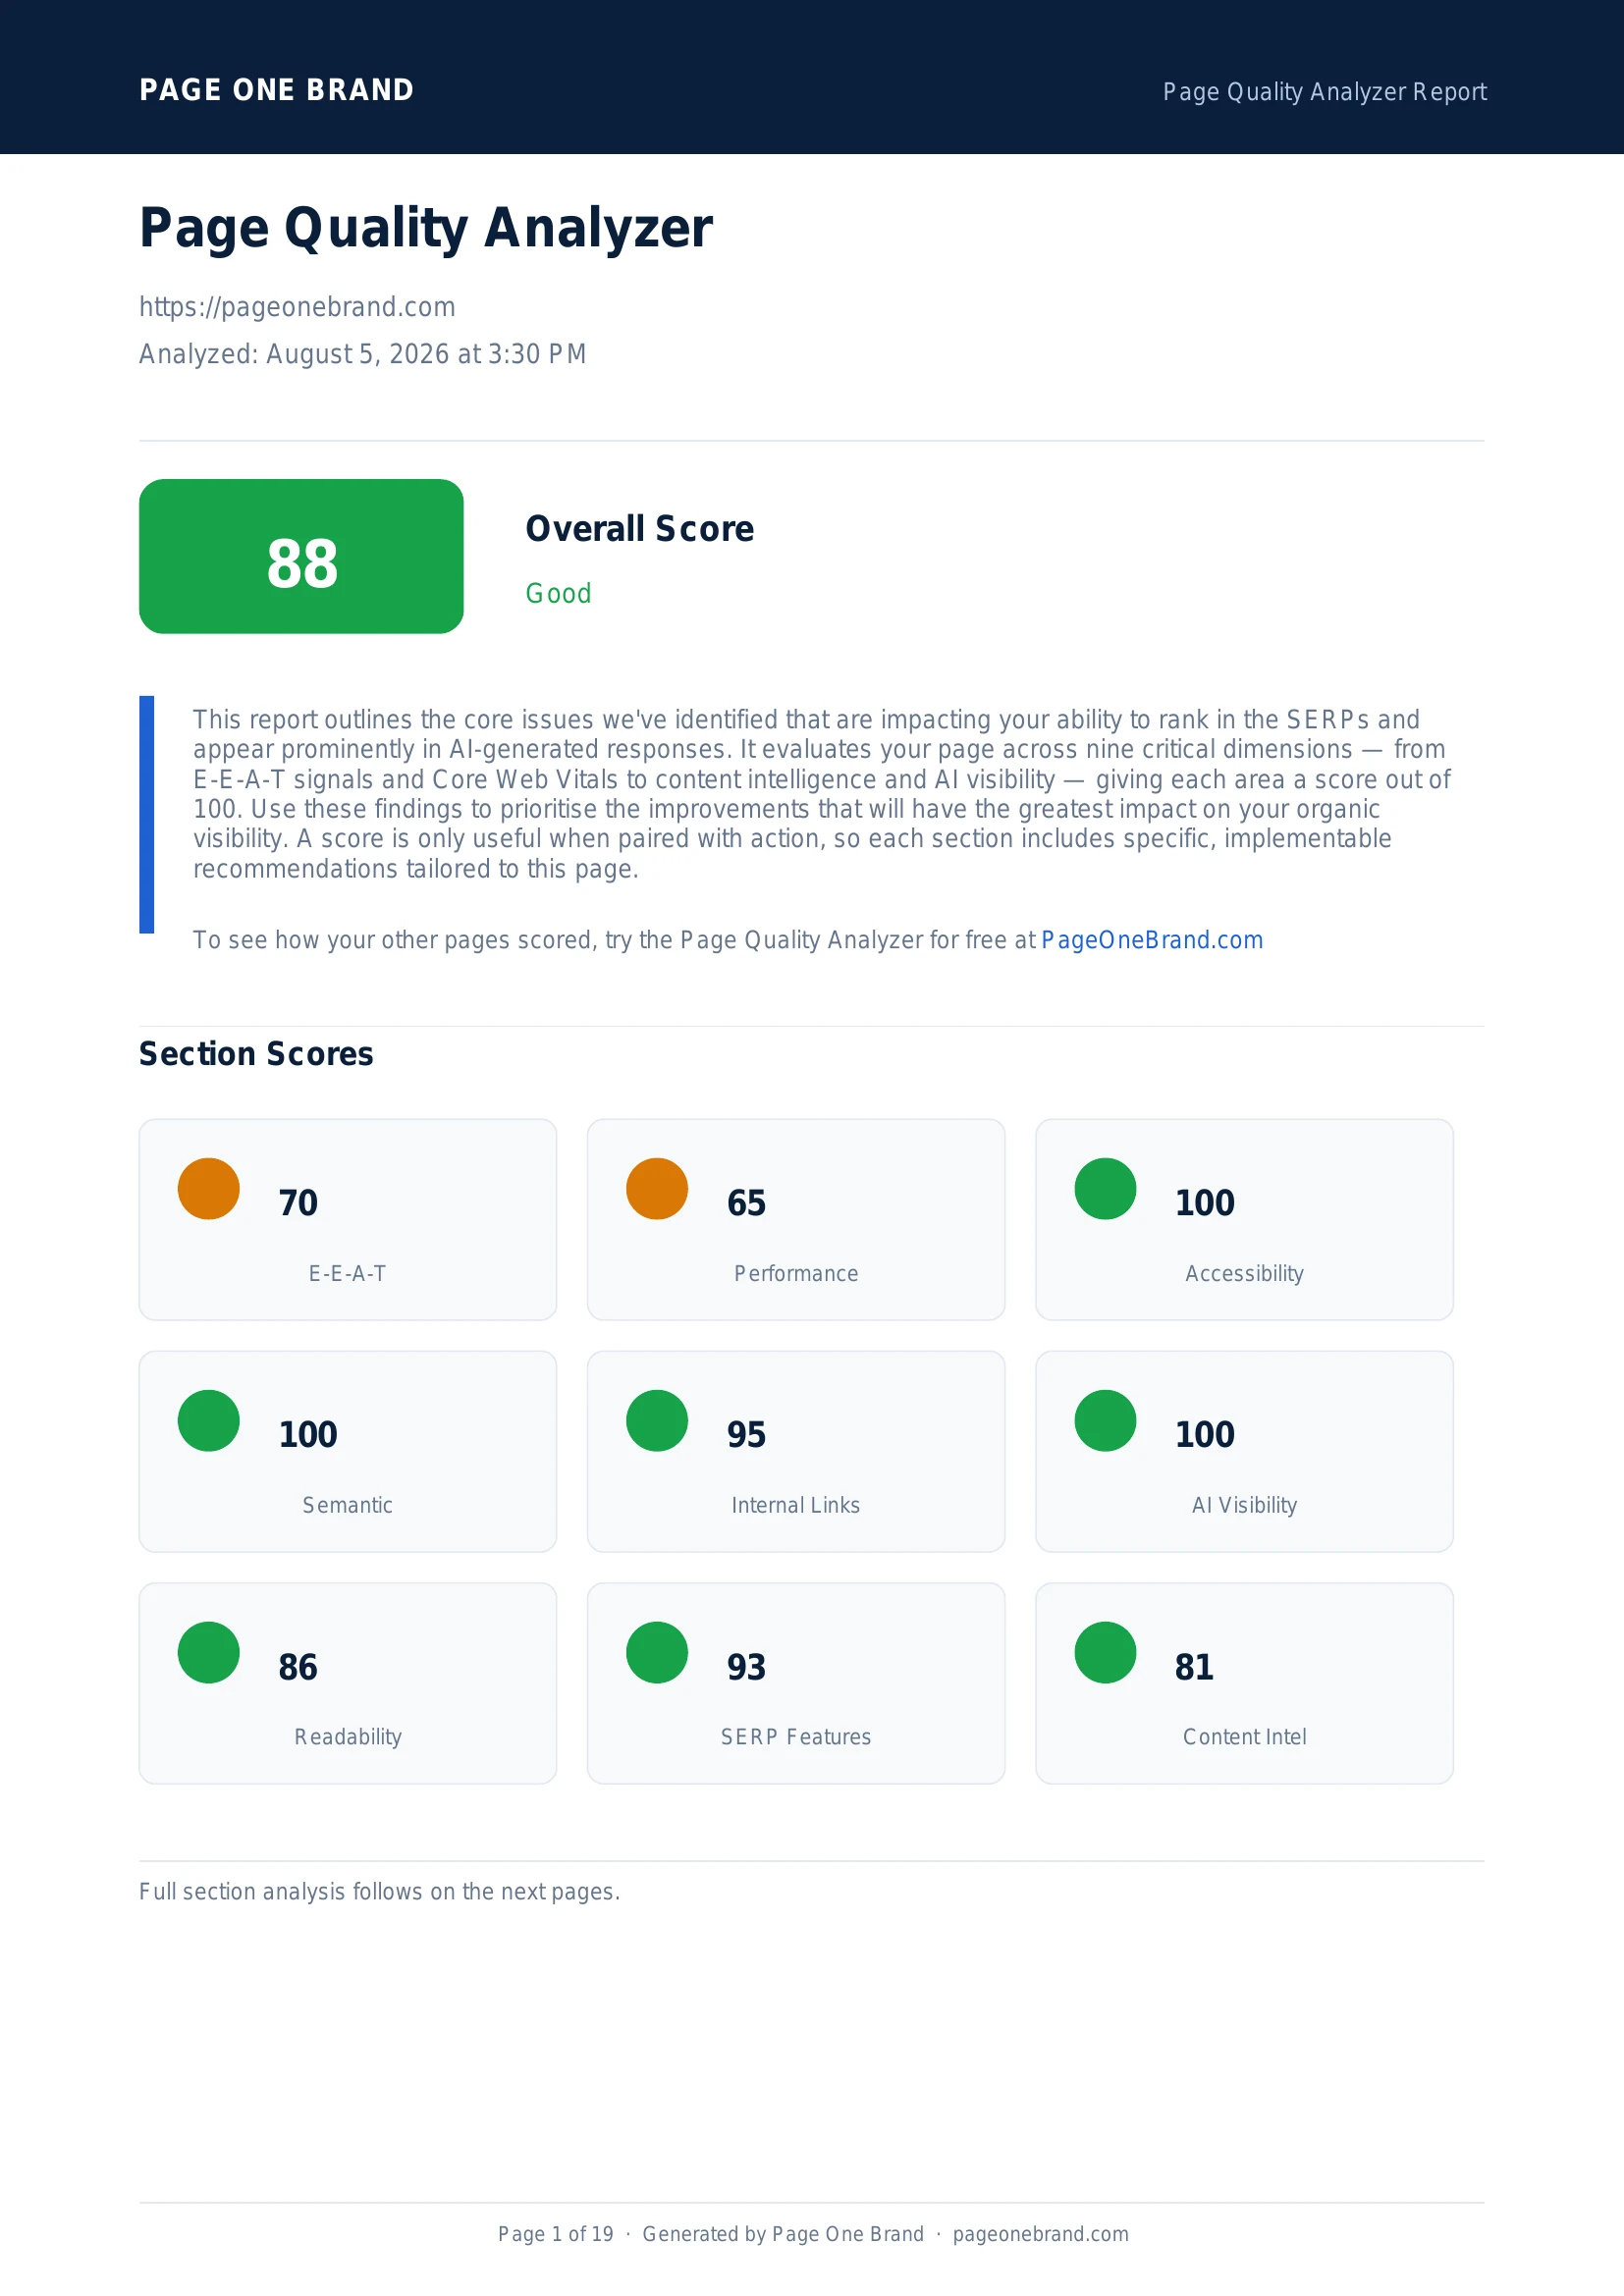 Speed Index is one of six performance signals that feed into the Core Web Vitals dimension of the Page Quality Analyzer.
How to Improve Your Speed Index
Inline your critical CSS. Extract the CSS rules needed to render the above-the-fold content and inline them directly in the head. Tools like Critical, Critters, and Penthouse automate this extraction.
Eliminate render-blocking JavaScript. Add defer or async to scripts that do not need to run before the first paint. Move non-critical third-party scripts to load after the initial render.
Use font-display: swap for web fonts. Without it, browsers using FOIT (Flash of Invisible Text) show blank text until the font loads. With swap, text renders immediately in the fallback font — improving Speed Index without changing when the font actually loads.
Speed Index and FCP often respond to the same fixes. Work through the opportunities listed in the Performance section of your Page Quality Analyzer report in order of impact, and Speed Index will improve alongside the other metrics.
Speed Index in Context: How Progressive Rendering Changes the Score
The easiest way to understand Speed Index is through two pages that both finish loading at 3.0 seconds but have completely different visual loading curves.
| Time | Page A (Step-load) | Page B (Progressive-load) |
|---|
| 0.5 s | 0% visible | 20% visible |
| 1.0 s | 0% visible | 45% visible |
| 1.5 s | 0% visible | 70% visible |
| 2.0 s | 0% visible | 88% visible |
| 3.0 s | 100% visible | 100% visible |
| Speed Index | ≈ 2.8 s (Poor) | ≈ 1.2 s (Good) |
Page A stays blank until 3.0s then appears all at once. Page B progressively fills in from 0.5s. Both complete at the same time — but Speed Index measures the area above the visual completeness curve, so Page B scores dramatically better. This is why server-side rendering, progressive image loading, and streaming HTML improve Speed Index even when they do not change the total load time.
Speed Index vs FCP vs LCP: Three Dimensions of Visual Loading
Each metric captures a different aspect of the visual loading experience. You need all three to fully diagnose a performance problem.
- FCP — When does the page show anything at all? Measures the moment of first paint. A fast FCP prevents users from thinking the page is broken.
- Speed Index — How fast does the page fill in between FCP and full visual completion? Measures the rate of progressive rendering. A fast Speed Index means users see meaningful content early, not just a spinner.
- LCP — When does the most important content element finish? Measures the completion of the primary content. A fast LCP means users do not wait to see the main subject of the page.
A common failure pattern: FCP is fast (a loading spinner appears at 0.3s) but Speed Index is slow (the real content does not fill in until 4s). FCP passes; Speed Index fails. This is the skeleton screen anti-pattern — showing a loading state immediately improves FCP but does nothing for Speed Index or LCP because the actual content is still loading.
Lighthouse Performance Score Weights
Speed Index is one of six metrics that contribute to the Lighthouse Performance score. Understanding the weights helps you prioritise which metrics to fix first.
| Metric | Weight | What it measures |
|---|
| Total Blocking Time (TBT) | 30% | Main thread blockage during load |
| Largest Contentful Paint (LCP) | 25% | Largest element fully rendered |
| Cumulative Layout Shift (CLS) | 25% | Visual stability during load |
| First Contentful Paint (FCP) | 10% | First content painted |
| Speed Index (SI) | 10% | Rate of visual completeness |
| Interaction to Next Paint (INP) | — | Field metric, not in lab score |
TBT and LCP together account for 55% of the Lighthouse Performance score. This means reducing JavaScript execution time (TBT) and optimising your hero image (LCP) will move your score more than any other changes. Speed Index at 10% is still meaningful — but only pursue it after the heavier-weighted metrics are under control.
How to Visualise Speed Index: Filmstrip Analysis
The most useful tool for diagnosing Speed Index is the filmstrip view — a series of screenshots taken at regular intervals during the page load, showing exactly what was visible at each moment.
In Chrome DevTools: Open the Performance panel → click the Screenshot checkbox → record a page load. A filmstrip appears at the top of the timeline. Each frame shows what was visible in the viewport at that moment. Frames that remain blank for multiple seconds indicate a render-blocking condition contributing to poor Speed Index.
In WebPageTest: Run a test at webpagetest.org. The filmstrip view is shown by default below the waterfall chart. WebPageTest also calculates Speed Index directly and overlays it on the visual completeness graph. This is the reference implementation — Lighthouse uses the open-source Speedline library (also developed by the WebPageTest team) to produce its Speed Index value.
Frequently Asked Questions About Speed Index
Why is Speed Index harder to improve than FCP or LCP?
FCP and LCP have relatively clear causes — a slow server response, a render-blocking resource, or a large unoptimised image. Speed Index is holistic: it penalises anything that delays progressive rendering, including render-blocking CSS, client-side rendering, fonts with FOIT, layout shifts that push content out of the viewport, and lazy-loaded content that does not appear quickly enough. Improving Speed Index often requires multiple small changes across several resource types rather than one big fix.
How does Lighthouse measure Speed Index?
Lighthouse uses an open-source Node.js library called Speedline to calculate Speed Index. During a Lighthouse audit, Chrome is driven headlessly and screenshots are captured every 100ms during the page load. Speedline analyses each screenshot's pixel data to determine what percentage of the above-the-fold viewport is visually complete. Speed Index is then calculated as the weighted average of the time at which each percentage point of visual completeness is reached — mathematically, the area above the visual progress curve.
What is the difference between Speed Index and Time to Interactive?
Speed Index measures visual completeness — how quickly the page looks done. Time to Interactive (TTI) measures functional completeness — when the page actually responds to user input reliably. A page with a fast Speed Index but slow TTI looks fully loaded but freezes or delays when the user clicks. The two metrics address different problems: Speed Index catches rendering delays; TTI catches JavaScript execution blocking. Improving one does not automatically improve the other.
Does Speed Index matter for SEO?
Speed Index is not itself a direct SEO ranking factor. Google uses Core Web Vitals (LCP, CLS, and INP) in its page experience signal. However, a poor Speed Index often accompanies poor LCP and FCP, which are incorporated into the overall performance assessment. More practically, Speed Index reflects the user experience quality of your page. Pages that load progressively and quickly keep users engaged. Pages that stay blank for multiple seconds produce high bounce rates, which is a quality signal Google picks up through engagement data.
Editorial implementation brief · Performance
Use the filmstrip to explain a Speed Index result
Speed Index is a lab visualization metric: it summarises how quickly the viewport becomes visually complete. It is most useful when paired with the filmstrip and the rendering work that caused blank or incomplete frames.
What to check, in order
- Run the same Lighthouse configuration and inspect the filmstrip, not just the score.
- Identify whether the first useful pixels are delayed by TTFB, CSS, fonts, JavaScript, or a client-rendered shell.
- Prioritise the critical path: server response, critical CSS, above-the-fold content, and the LCP resource.
- Do not hide unfinished content with a spinner if the page can render stable structure immediately.
- Compare Speed Index with FCP, LCP, and field data; no single lab metric describes the whole experience.
Copy-paste example
<link rel="preload" href="/styles/critical.css" as="style">
<link rel="stylesheet" href="/styles/critical.css">
<main>
  <h1>Useful content can render before the app hydrates.</h1>
</main>
Evidence from our workflow
Our evidence record includes the Lighthouse filmstrip and the timings that explain its shape. We label Speed Index as a diagnostic rather than a Google Core Web Vital, then verify the user-facing result with LCP and field data.
Primary sources
Editorial note: This guide was written by Robert Belkin, Founder & Lead Strategist at Page One Brand, and technically reviewed by Robert Belkin on August 25, 2026. See the author profile, scoring methodology, and contact page for supporting business and editorial information.