Core Web Vitals & Performance
Time to Interactive (TTI): Why Your Page Looks Ready Before It Is
By Robert Belkin, Founder & Lead Strategist
Published · Reviewed by Robert Belkin · 6 min read
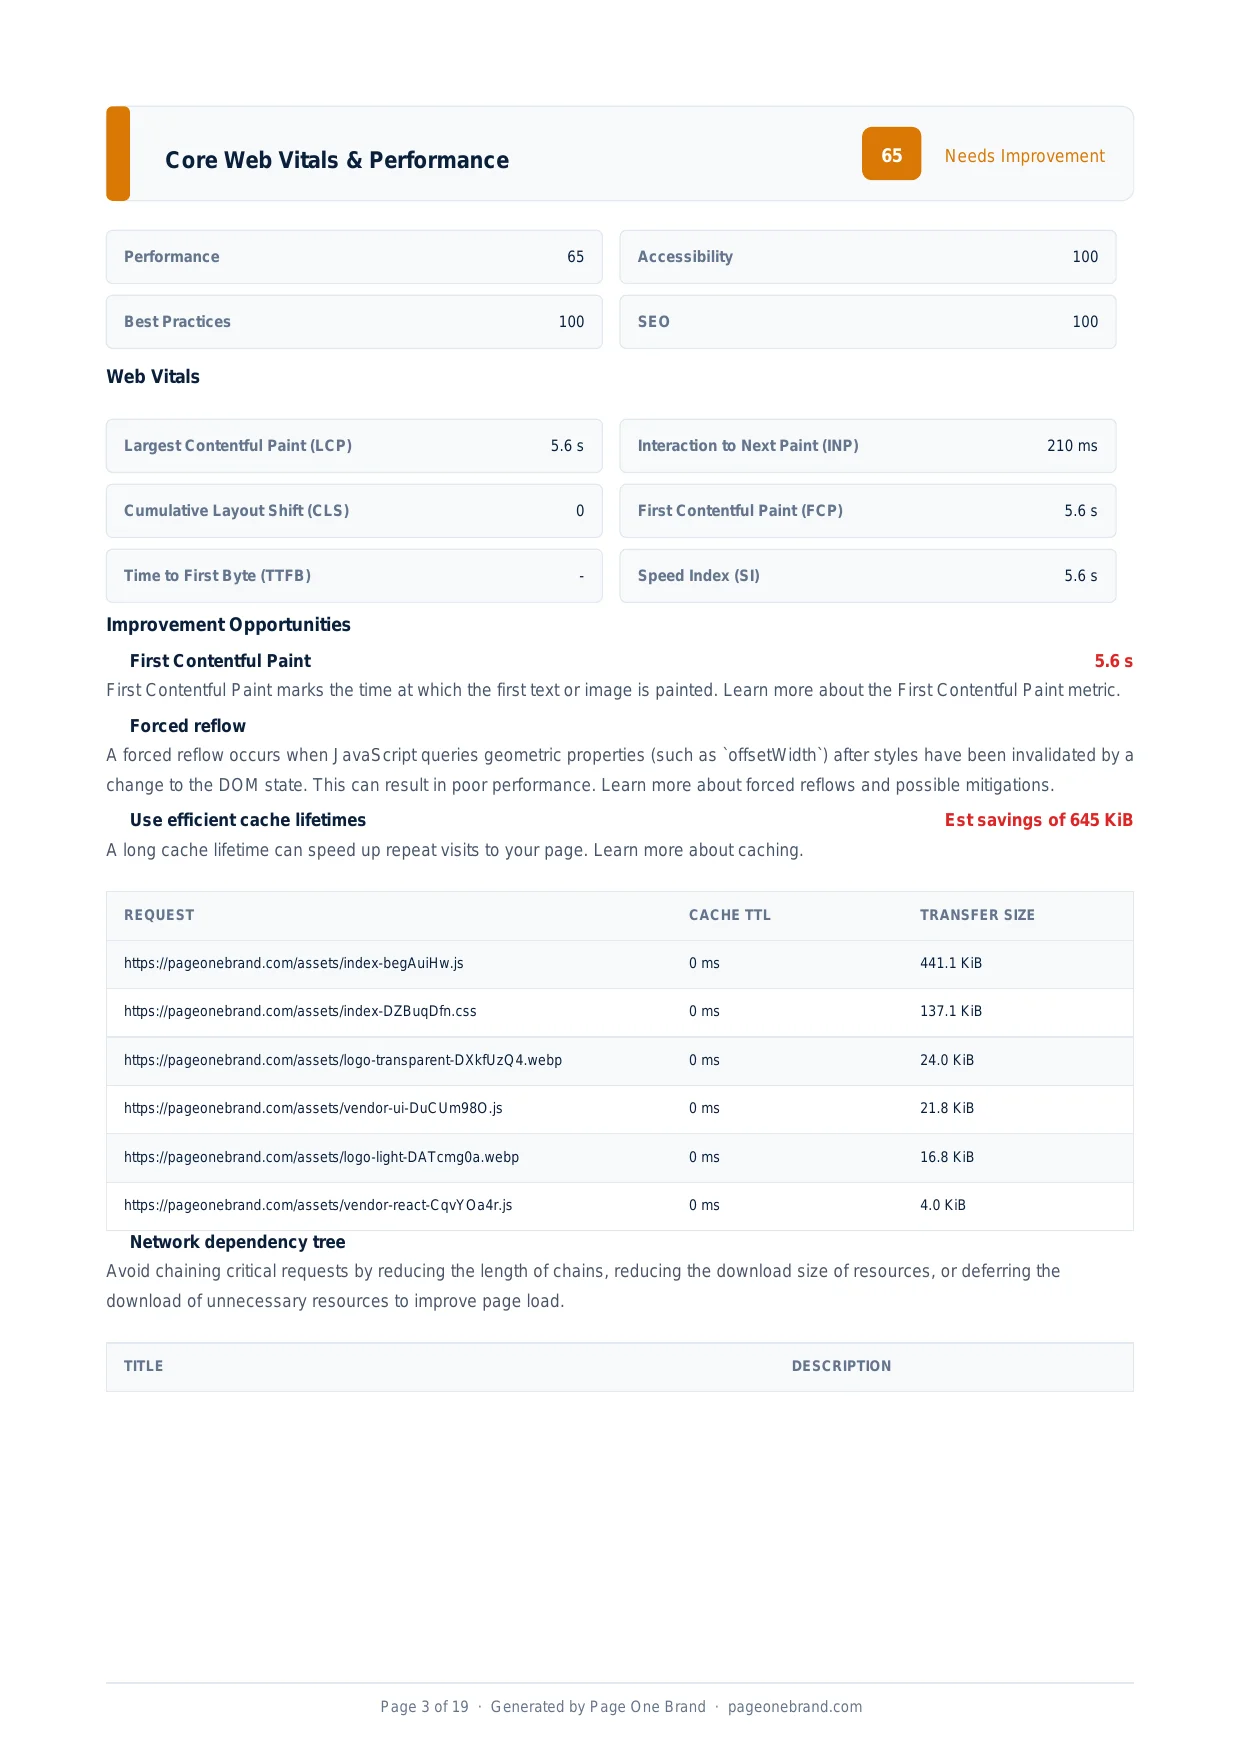
Time to Interactive — TTI — measures the point at which a page becomes fully and reliably interactive: clicks register immediately, scrolls are smooth, and form inputs respond without delay. It is not about how quickly the page looks done. It is about when the page actually is done — and the gap between those two moments is where a huge amount of user frustration lives.
How TTI Is Calculated
Lighthouse calculates TTI by finding the earliest point after the First Contentful Paint where the main thread is quiet for at least five consecutive seconds, with no long tasks (tasks taking over 50ms) in that window. The last long task before that quiet window marks the TTI boundary.
In practice, a page can have a fast FCP — content appearing on screen at 1.5 seconds — but a TTI of 6 or 7 seconds if JavaScript bundles are still downloading and executing during that time. The user sees a page that looks complete but clicks on a button and nothing happens. This is what TTI captures.
Google's thresholds for TTI: good is below 3.8 seconds, needs improvement is 3.8 to 7.3 seconds, and poor is above 7.3 seconds.
The Performance section of a Page Quality Analyzer report — TTI and Max Potential FID appear alongside FCP and LCP to reveal when the page becomes genuinely usable.
What Causes a High TTI
Large JavaScript bundles. The main culprit in nearly every case. When a framework bundles all application code into a single file, the browser must download, parse, compile, and execute the entire bundle before interactivity is possible. A 500 KiB uncompressed JavaScript bundle on a mid-range mobile device on a 4G connection can easily consume 3 to 4 seconds of main thread time on its own.
Third-party scripts. Analytics, chat widgets, advertising pixels, and social embeds all execute on the main thread. Each contributes to total main thread work, and any that runs as a single synchronous block creates a long task that delays TTI.
Framework hydration. React, Vue, and Angular all run a hydration phase after the initial HTML is painted — attaching event listeners and making the page interactive. For large component trees, hydration itself can generate long tasks that push TTI well past what the visual FCP time would suggest.
How to Reduce TTI
Code-split your JavaScript. Dynamic imports ensure only the JavaScript needed for the current page loads on initial navigation. Route-level splitting means each bundle is typically 10 to 30% of the full bundle size, proportionally reducing parse and execution time.
Defer non-critical scripts. Third-party scripts that are not needed for initial interaction should load with the defer attribute or be loaded dynamically after the page reaches TTI. A chat widget that nobody uses on the first visit should not block interactivity for every user.
Move heavy computation off the main thread. Web Workers run JavaScript in a background thread. Image processing, data parsing, sorting, and other CPU-intensive tasks are good candidates for Worker offloading. The main thread stays free for rendering and input handling while the Worker computes.
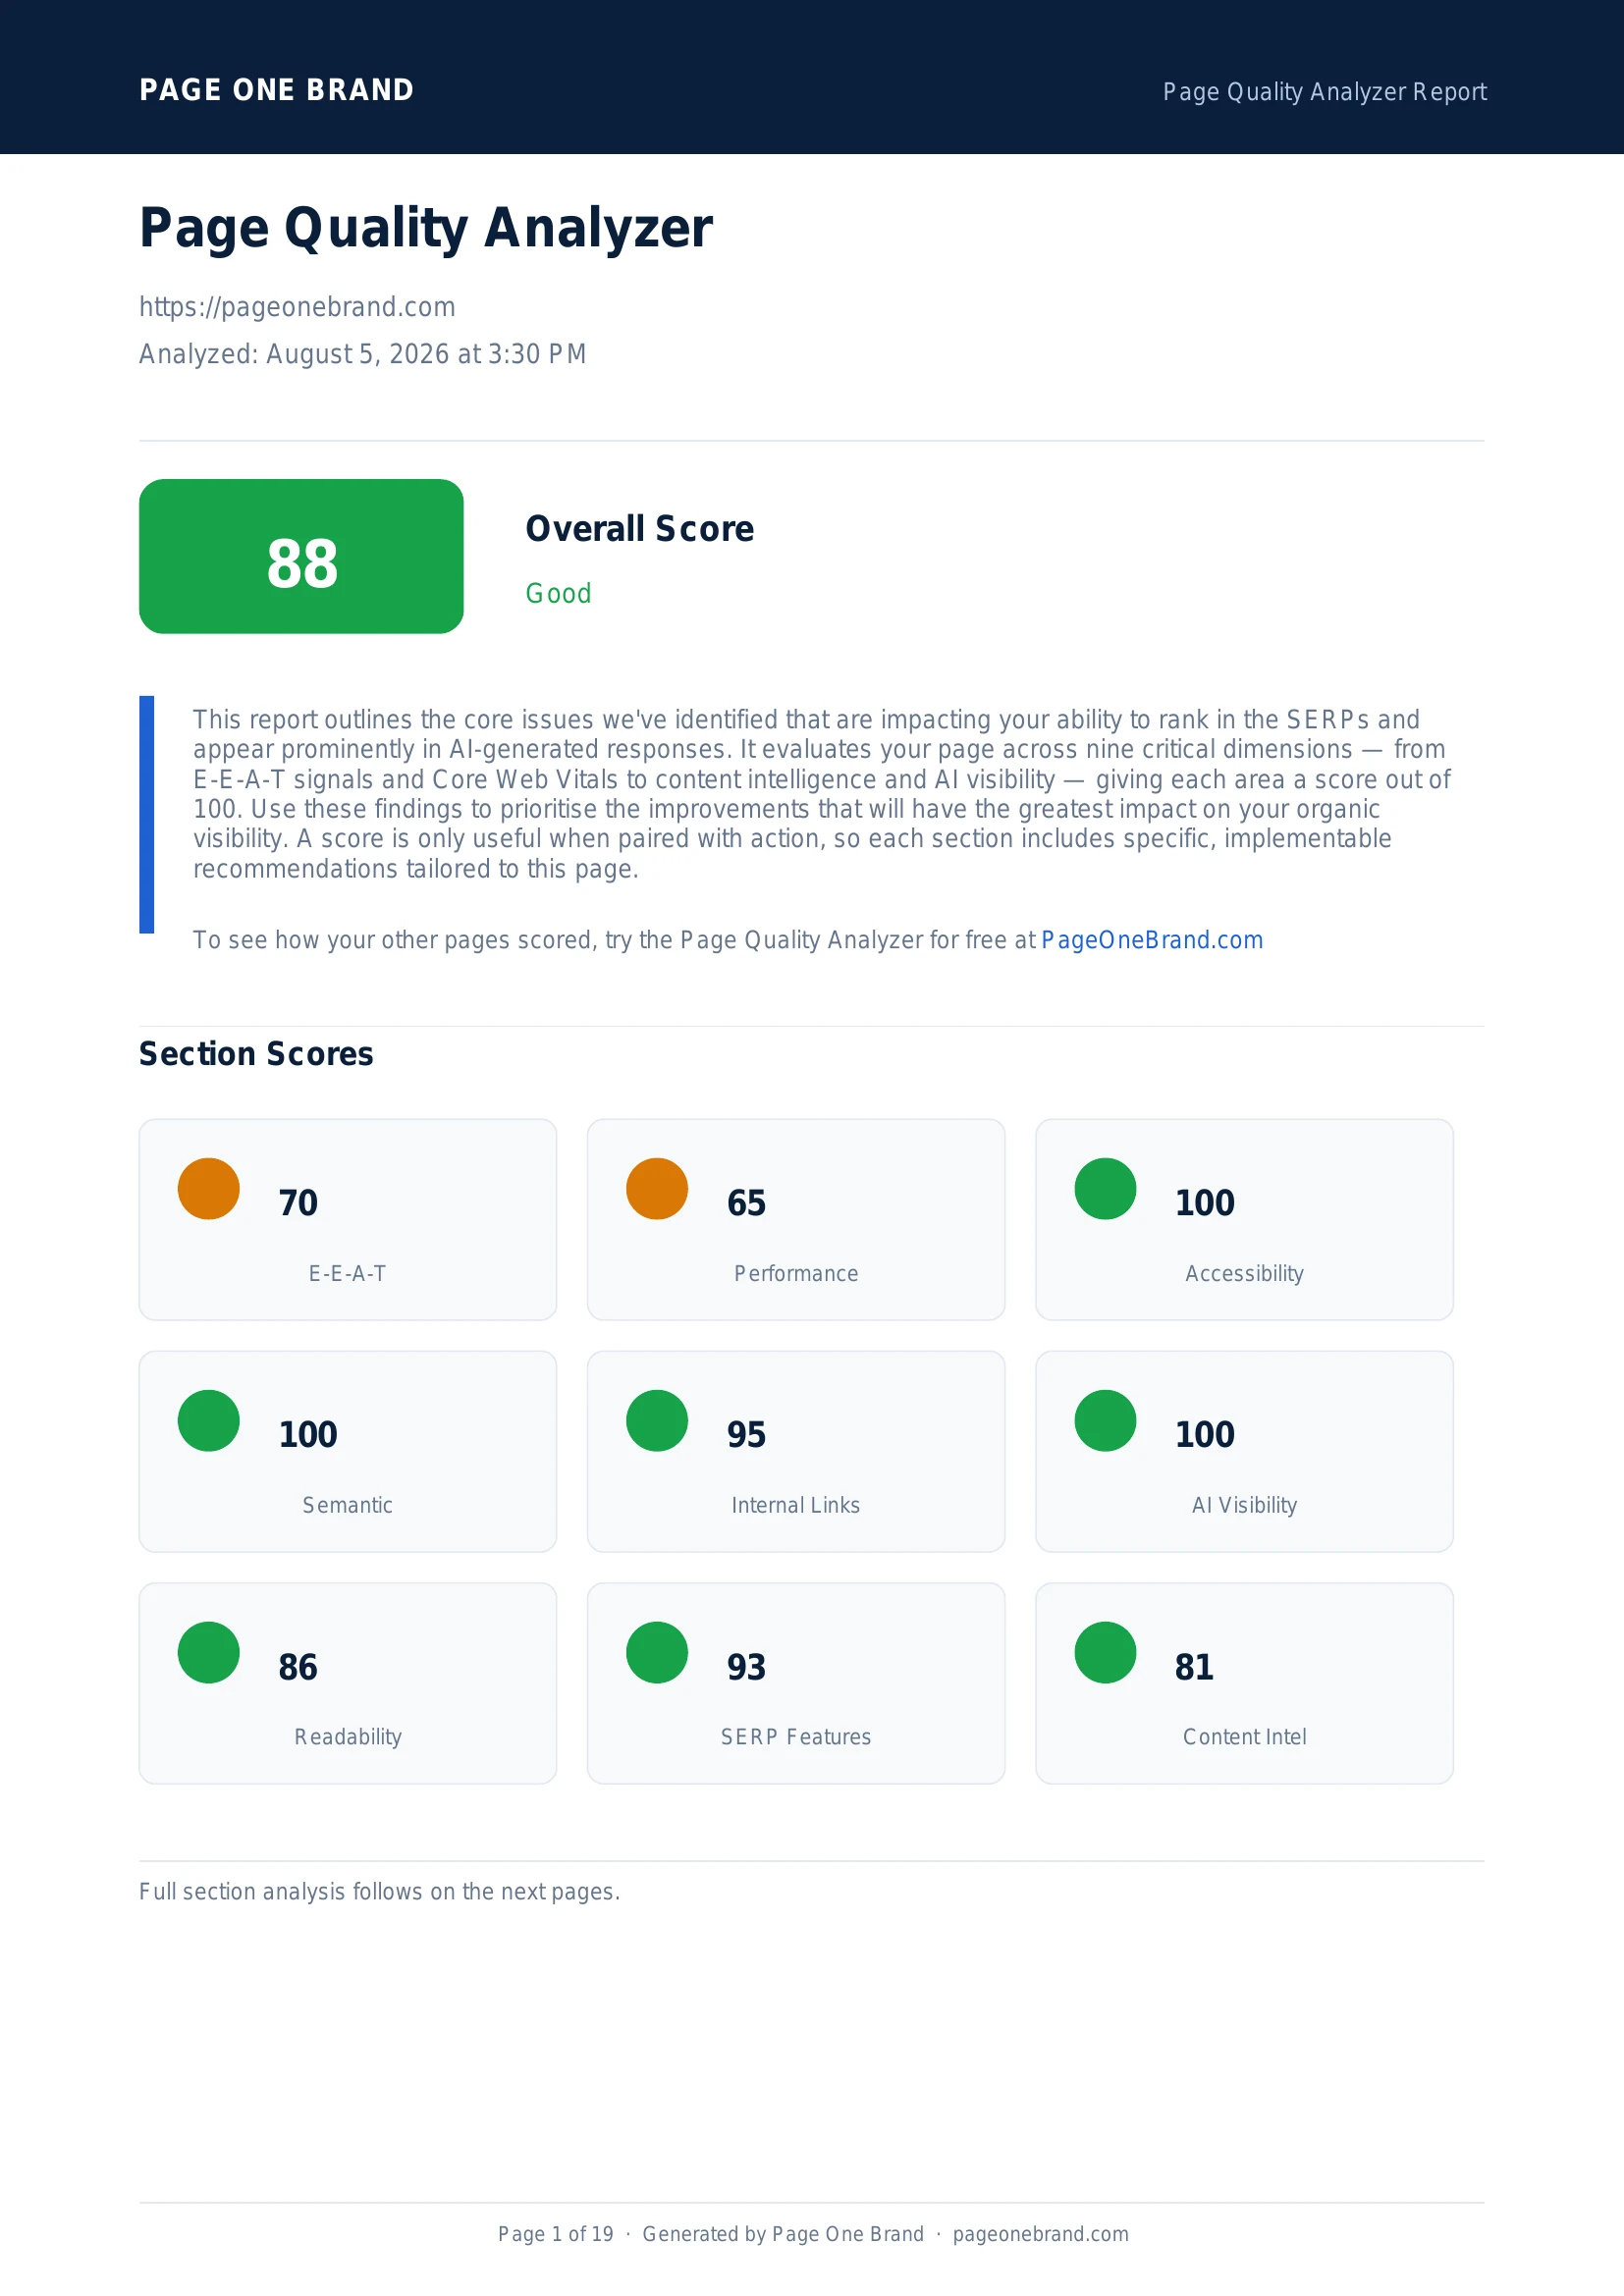 The Page Quality Analyzer evaluates performance holistically — TTI is one of several signals that feed into the overall Performance dimension score.
TTI vs INP: Understanding the Shift
TTI is a lab metric — it models interactivity based on main thread quietness. It does not directly measure whether real user interactions actually respond quickly. Interaction to Next Paint (INP), which became a Core Web Vital in 2024, fills this gap by measuring the actual response latency of every user interaction during a session.
Optimising for TTI and optimising for INP largely overlap: both require reducing JavaScript execution time on the main thread, breaking up long tasks, and avoiding synchronous operations during user interactions. If your TTI is high, your INP is likely also suffering.
The Page Quality Analyzer reports both TTI from Lighthouse lab data and INP from the live PageSpeed Insights API, giving you both the diagnostic lab view and the real-user signal in one scan.
Frequently Asked Questions About Time to Interactive
How is Time to Interactive (TTI) calculated?
Lighthouse calculates TTI by finding the earliest point after First Contentful Paint where the main thread is quiet for at least five consecutive seconds, with no long tasks (tasks taking over 50ms) in that window. The last long task before that quiet window marks the TTI boundary. A page can have a fast FCP — content appearing at 1.5 seconds — but a TTI of 6 or 7 seconds if JavaScript bundles are still downloading and executing during that time. Google's thresholds: good is below 3.8 seconds, needs improvement is 3.8 to 7.3 seconds, and poor is above 7.3 seconds.
What is the difference between TTI and INP?
TTI is a lab metric that models interactivity based on main-thread quietness — it does not directly measure whether real user interactions actually respond quickly. Interaction to Next Paint (INP), which became a Core Web Vital in 2024, fills this gap by measuring the actual response latency of every user interaction during a session. Optimising for TTI and INP largely overlaps: both require reducing JavaScript execution time on the main thread, breaking up long tasks, and avoiding synchronous operations during user interactions. If your TTI is high, your INP is likely also suffering.
What is the most common cause of a high TTI?
Large JavaScript bundles are the main culprit in nearly every case. When a framework bundles all application code into a single file, the browser must download, parse, compile, and execute the entire bundle before interactivity is possible. A 500 KiB uncompressed JavaScript bundle on a mid-range mobile device can easily consume 3 to 4 seconds of main-thread time on its own. Framework hydration — the phase where React, Vue, or Angular attach event listeners after the initial HTML is painted — is a closely related cause. On large component trees, hydration itself can generate long tasks that push TTI well past the visual FCP time.
How do I reduce Time to Interactive on a JavaScript-heavy site?
Three changes deliver the most improvement. First, code-split your JavaScript with dynamic imports so only the code needed for the current page loads on initial navigation. Second, defer non-critical third-party scripts — analytics, chat widgets, and advertising pixels should load after the page reaches TTI rather than blocking it. Third, move heavy computation off the main thread using Web Workers, which run JavaScript in a background thread and leave the main thread free for rendering and input handling. Each of these changes reduces the length and number of long tasks that delay the quiet window Lighthouse uses to calculate TTI.
Editorial implementation brief · Performance
Measure what users experience, not only a retired lab label
TTI describes a quiet main thread after first paint, but it is no longer the primary user-facing responsiveness metric. Use it to understand a legacy report; use INP and interaction traces for current decisions.
What to check, in order
- Record FCP, TTI (when a legacy audit still exposes it), and the longest tasks in the same run.
- Check whether hydration, parsing, or third-party scripts occupy the main thread after the first paint.
- Code-split route features, defer non-critical scripts, and yield between expensive work.
- Measure real interactions with INP and annotate the interaction that is slow, not only page-load timings.
- Keep a browser/device profile and build version with the result so later comparisons remain valid.
Copy-paste example
// Defer non-critical work until the browser has a chance to respond.
requestIdleCallback?.(() => {
  import("./recommendations.js").then(({ warmCache }) => warmCache());
});
Evidence from our workflow
Our editorial notes call out when a metric is lab-only, retired, or a proxy. We preserve the trace that explains the delay and pair it with an actionable current metric so readers do not optimise a number detached from user experience.
Primary sources
Editorial note: This guide was written by Robert Belkin, Founder & Lead Strategist at Page One Brand, and technically reviewed by Robert Belkin on August 25, 2026. See the author profile, scoring methodology, and contact page for supporting business and editorial information.