SEO Strategy
What Your Page Quality Analyzer Score Actually Means
By Robert Belkin, Founder & Lead Strategist
Published · 9 min read
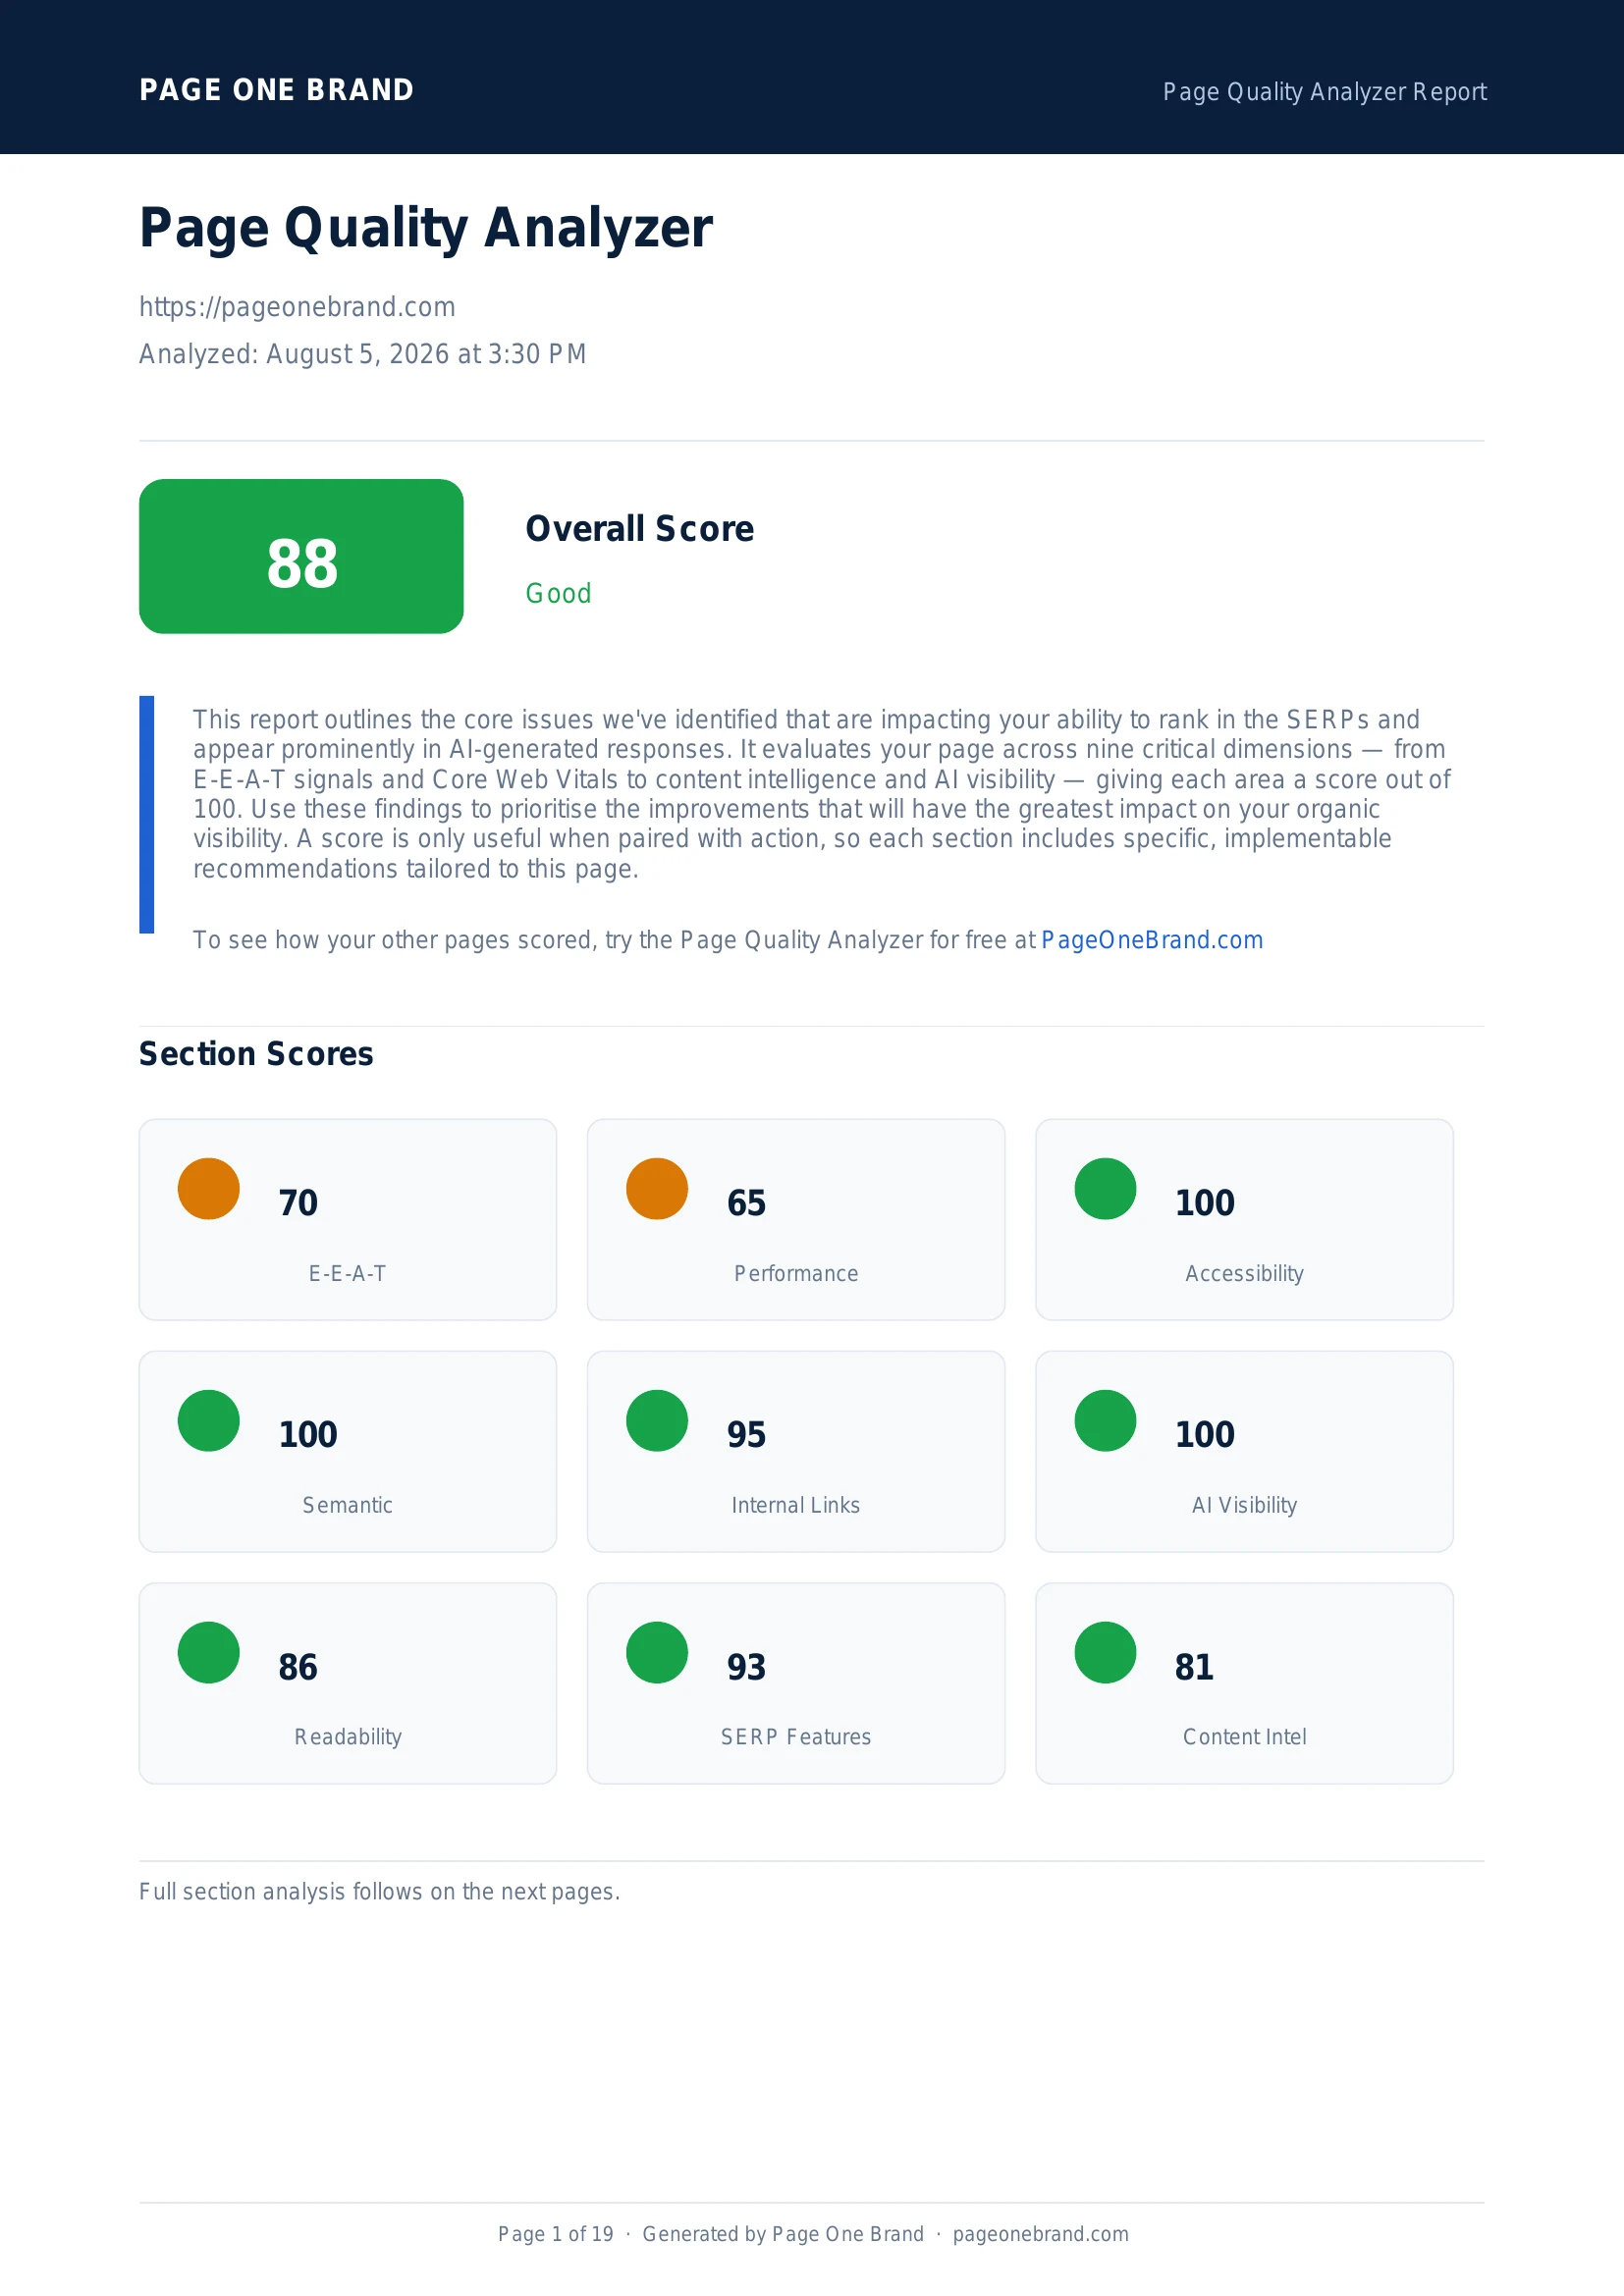
When you run a page through the Page Quality Analyzer and see your score, the natural instinct is to aim for 100. But that's not actually the right target — and understanding why will save you a lot of wasted effort.
Why 80 Is the Real Benchmark
An overall score of 80 or above is a genuine achievement. Most pages on the web don't reach it.
The analyzer evaluates nine independent dimensions simultaneously — E-E-A-T, Core Web Vitals, Accessibility, Semantic SEO, Internal Linking, AI Visibility, Readability, SERP Feature Readiness, and Content Intelligence. Each one draws on different signals: some are purely technical, some are judged by live Lighthouse data, and two (E-E-A-T and Content Intelligence) involve GPT-4 evaluation of your actual content. Scoring well across all nine at the same time is harder than it looks.
We've analyzed hundreds of pages — including well-funded brand sites, high-traffic blogs, and agency-optimised client pages. The average falls well below 80. Pages that consistently score 80 or above are doing something meaningfully right: their content is well-structured, their technical fundamentals are solid, and their on-page signals are aligned. That's worth recognising.
If your page scores 80 or above, treat it as a success. That's the benchmark that separates pages likely to perform from pages that won't.
Getting to 90 Is Genuinely Difficult
The jump from 80 to 90 isn't linear. It requires clean passes across dimensions that are structurally harder to improve.
Performance scores depend on Core Web Vitals data from the live Google PageSpeed Insights API. Getting a strong Performance score typically requires reducing render-blocking resources, shrinking JavaScript bundles, improving server response times, and passing real-user thresholds — work that often touches infrastructure and build tooling, not just content. Many well-optimised pages still score in the mid-60s on Performance because of framework overhead that can't easily be removed without a rebuild.
E-E-A-T is evaluated by GPT-4 against Google's Search Quality Rater Guidelines. Reaching a high E-E-A-T score requires independently verifiable author credentials, a detailed methodology with reproducible scoring criteria, cited statistics with source links, and ideally third-party validation. These are real content and business requirements — not things a developer can deploy in a pull request.
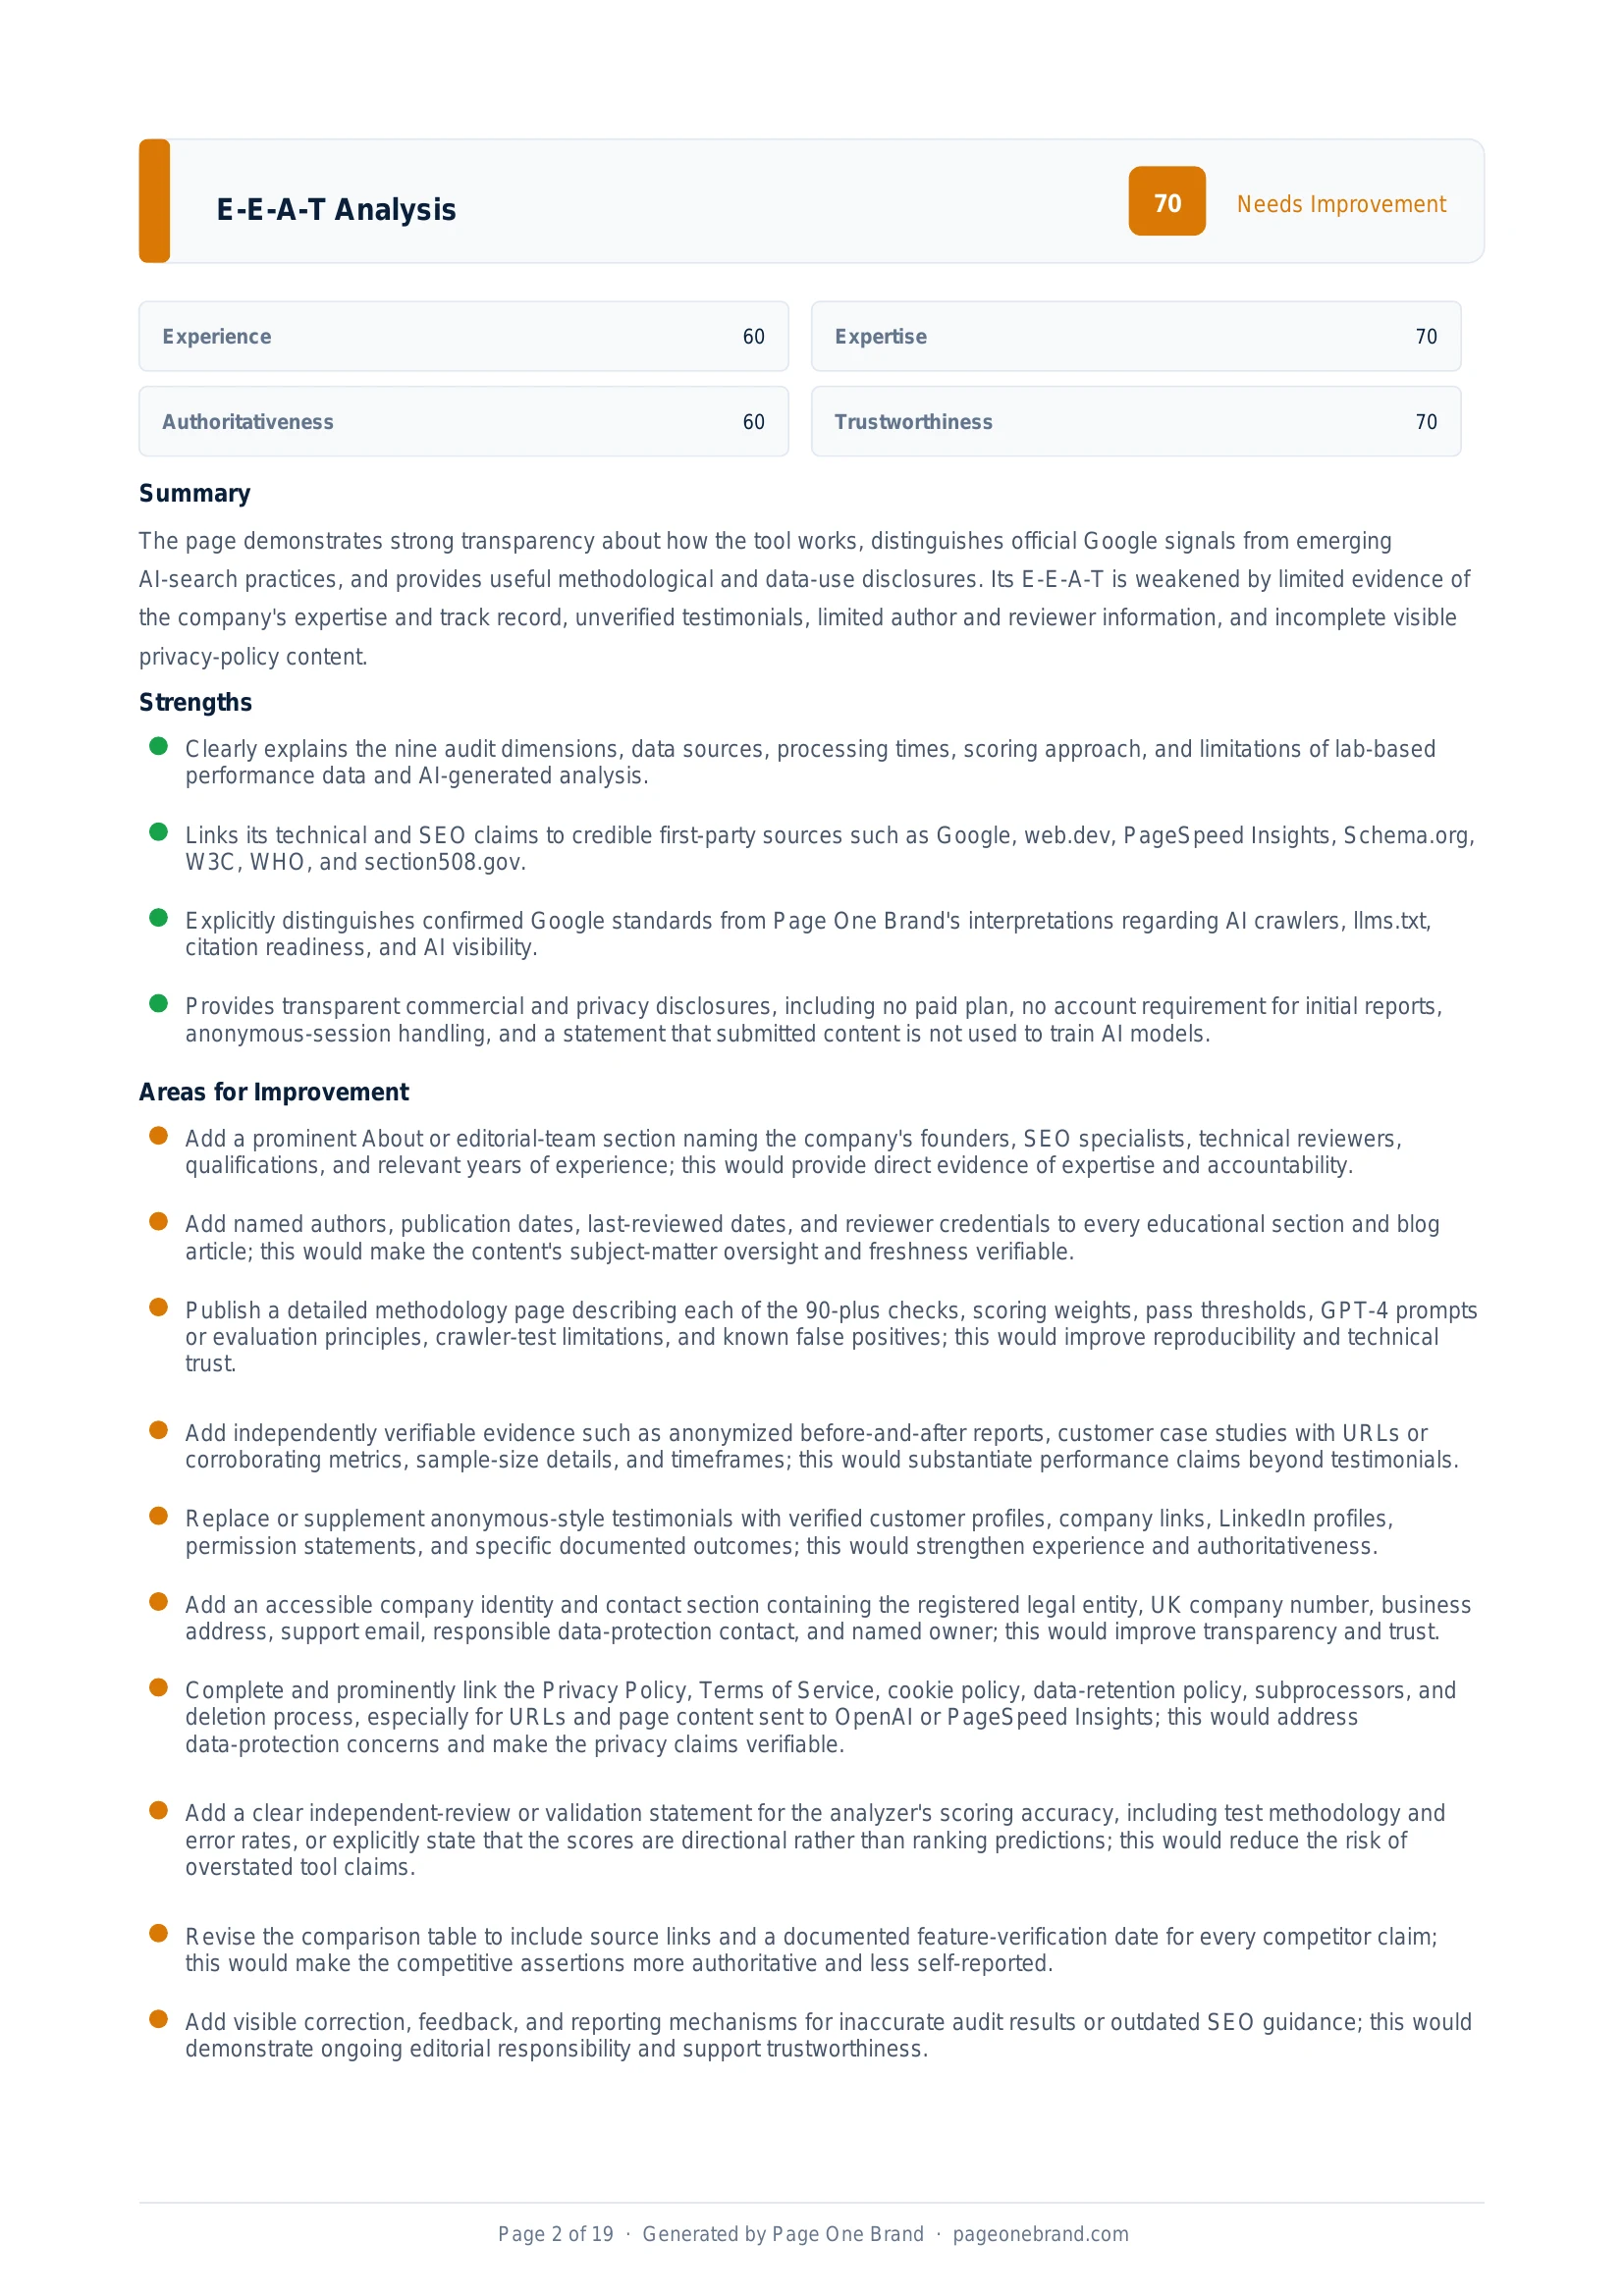 An E-E-A-T analysis from a real Page Quality Analyzer report — the sub-scores and recommendations reveal exactly which trust signals are missing.
Scores in the 85–90 range represent pages that have done everything reasonably well and have addressed most of their weak spots. Getting from there to 90 usually means attacking specific dimension bottlenecks methodically, deploying a fix, and scanning again to see if it moved. We know — we've done it ourselves.
95 and Above: Exceptional
Pages that score 95 or above are exceptional. At that level, you're not just scoring well on the easy checks — you've cleared the hard ones too.
Reaching 95+ typically means a Performance score in the 80s or higher (fast server, optimised assets, minimal unused JavaScript), an E-E-A-T score above 80 (verifiable expertise, case studies, cited sources), Content Intelligence above 85 (strong entity coverage, high information gain, clear topical authority), and clean passes across every rule-based dimension. It's the kind of score that represents months of deliberate improvement, not an afternoon of fixes.
If you reach 95, your page is genuinely in the top tier of what we see. It doesn't guarantee rankings — there are off-page factors the tool can't measure — but on the signals that are measurable, you're doing almost everything right.
Why 100 Is Nearly Impossible — And Why That's by Design
A perfect 100 is theoretically achievable, but in practice the nine scoring dimensions pull against each other in ways that make a clean sweep extremely unlikely.
Here are a few real examples of criteria that conflict:
- Performance vs. Content Richness. Improving your Readability score often means adding video embeds, images, and downloadable resources. Each of those adds page weight, which hurts Core Web Vitals. You're trading performance for content richness every time you add multimedia.
- External links vs. Internal Link balance. High-quality E-E-A-T and AI Visibility scores reward pages that cite authoritative external sources — government sites, W3C, Google documentation. But the Internal Linking check flags a high external-to-internal link ratio as a warning. The more credibly you cite external sources, the more that check pushes back.
- Content depth vs. Readability. Detailed methodology explanations, check-by-check criteria, and technical specifics all improve E-E-A-T and Content Intelligence. They also raise reading grade level and Flesch complexity, which can lower the Readability score. Comprehensive content and simple prose are genuinely in tension.
- Schema coverage vs. page weight. Adding every recommended schema type (FAQPage, HowTo, Article, VideoObject, SoftwareApplication, AggregateRating) improves SERP Feature Readiness significantly. It also adds kilobytes of JSON-LD to every page load — a small but real Performance cost.
The analyzer is designed to surface these tensions honestly rather than hide them. A score that reflects real trade-offs is more useful than one inflated by ignoring them.
Chasing 100 also runs the risk of making decisions that hurt the actual user experience. Embedding a video just to pass the video check, or stuffing statistics into every paragraph to satisfy the factual-density check, produces content that feels optimised rather than useful. The scores are a proxy for quality — the goal is the quality, not the number.
A Practical Scoring Guide
| Score range |
What it means |
| Below 60 |
Significant gaps across multiple dimensions. Prioritise quick wins: fix missing meta tags, add schema, correct broken links, improve page speed. |
| 60–74 |
A workable baseline. Most pages in this range have one or two hard bottlenecks holding them back. Identify the lowest-scoring dimensions and address them one at a time. |
| 75–84 |
Good. You're above average and the fundamentals are solid. Further gains require deliberate, targeted work on specific dimension gaps. |
| 85–89 |
Very good. You've addressed most of the improvable signals. Getting higher means tackling the hard structural issues — Performance, E-E-A-T, or Content Intelligence — which require more than surface-level fixes. |
| 90–94 |
Excellent. This takes sustained, systematic effort. You're well above average across every dimension that can be measured. |
| 95+ |
Exceptional. Reserved for pages where technical performance, content authority, and on-page signals have all been optimised to a high standard simultaneously. |
Focus on the Dimensions You Control
Some dimensions have hard ceilings based on your current setup. A React single-page application will always face Performance challenges from JavaScript bundle size that a static HTML page won't. A new brand without customer case studies will always have lower E-E-A-T than one with years of verifiable results. These aren't reasons to give up — they're reasons to focus your energy where it's most likely to move the needle.
Start with the rule-based dimensions. Semantic SEO, Accessibility, Internal Linking, AI Visibility, and SERP Feature Readiness all have deterministic checks with clear pass/fail criteria. These are the easiest to improve and the most predictable to fix. Get all of those to 90+ first.
Then turn to Performance and Readability. Performance requires technical work but the improvements are measurable and lasting. Readability benefits from structured content: clear headings, short paragraphs, bullet lists, and at least one multimedia element.
Leave E-E-A-T and Content Intelligence for last. These are the most valuable dimensions for long-term organic performance, but they're also the slowest to improve. Building verifiable expertise, publishing cited research, and earning a reputation for accuracy takes time — it can't be deployed in a sprint.
The Bottom Line
An 80 is worth celebrating. A 90 is hard-won. A 100 is a theoretical ceiling most pages will never reach — and that's fine.
Use the scores as a map, not a report card. Each dimension tells you something specific about where your page is strong and where it has room to grow. A score of 82 with a Performance bottleneck tells you something different from an 82 with an E-E-A-T gap — and each one points to a different set of fixes.
Run the analyzer, read the dimension breakdowns, pick the most actionable gap, and close it. Then run it again. That's the process — and it works whether you're starting at 55 or trying to push from 87 to 90.
Frequently Asked Questions About Page Quality Scores
Why is 80 considered the real benchmark for a Page Quality Analyzer score?
An overall score of 80 or above is a genuine achievement because the analyzer evaluates nine independent dimensions simultaneously — E-E-A-T, Core Web Vitals, Accessibility, Semantic SEO, Internal Linking, AI Visibility, Readability, SERP Feature Readiness, and Content Intelligence. Two of those dimensions (E-E-A-T and Content Intelligence) involve GPT-4 evaluation of your actual content, and Performance depends on real-user Core Web Vitals data from Google's PageSpeed Insights API. Scoring well across all nine at the same time is harder than it looks. Analysis of hundreds of pages confirms that most fall well below 80. Pages consistently above 80 are doing something meaningfully right across all dimensions simultaneously.
What does it mean if my page scores below 60?
A score below 60 indicates significant gaps across multiple dimensions. It typically reflects a combination of missing meta tags, no structured data schema, poor accessibility, weak content signals, and often a Performance score dragged down by unoptimised images or render-blocking JavaScript. The recommended approach is to start with quick wins: fix missing meta tags, add basic schema markup, correct broken links, and address any critical accessibility failures. These are deterministic fixes that can move the score meaningfully in a single sprint. Avoid tackling E-E-A-T or Content Intelligence first — those take longer and are harder to move.
Why is a perfect score of 100 nearly impossible to achieve?
The nine scoring dimensions pull against each other in ways that make a clean sweep extremely unlikely. Improving Readability often means adding video embeds and images, which adds page weight and hurts Core Web Vitals. High-quality E-E-A-T and AI Visibility scores reward citing authoritative external sources, but the Internal Linking check flags high external-to-internal link ratios. Detailed methodology explanations improve E-E-A-T and Content Intelligence but raise reading grade level, lowering the Readability score. The analyzer is designed to surface these tensions honestly — a score that reflects real trade-offs is more useful than one inflated by ignoring them.
Which Page Quality Analyzer dimensions are fastest to improve?
The five rule-based dimensions — Semantic SEO, Accessibility, Internal Linking, AI Visibility, and SERP Feature Readiness — are the fastest to improve because every check has a clear pass or fail with a deterministic fix. Missing a canonical tag, an Open Graph image, or a descriptive anchor text are all addressable in minutes. Start with these five and get them all to 90 or above before tackling Performance and Readability. Leave E-E-A-T and Content Intelligence for last — these are evaluated by GPT-4 and require substantive editorial work like adding named authors, original data, and cited sources, which takes longer to implement and longer for Google to process.