Technical SEO
Core Web Vitals and Page Speed: How Performance Affects Your Search Rankings
By Robert Belkin, Founder & Lead Strategist
Published · 11 min read
Page speed has been a ranking factor since 2010. Core Web Vitals — the specific metrics Google uses to measure real-user page experience — became a confirmed ranking signal in 2021. If your page is slow, Google knows, and it affects where you appear in search results.
Why Performance Matters for SEO
Speed affects rankings in two distinct ways. The direct way: Google's Page Experience ranking signal uses Core Web Vitals data from the Chrome User Experience Report — real measurements from real Chrome users — to assess whether a page is fast and stable. Pages that fail the Core Web Vitals thresholds are eligible for a ranking downgrade relative to pages that pass.
The indirect way: slow pages drive users away. When a page takes more than three seconds to load, over half of mobile users abandon it. A high bounce rate signals to Google that users found your result unhelpful — which compounds the direct speed penalty over time. Conversely, fast pages keep users engaged longer, which sends positive signals.
Performance is also one of the hardest dimensions to improve because the root causes are often structural. JavaScript-heavy frameworks, unoptimised images, missing caching headers, and bloated third-party scripts all degrade speed in ways that require infrastructure changes — not just content edits.
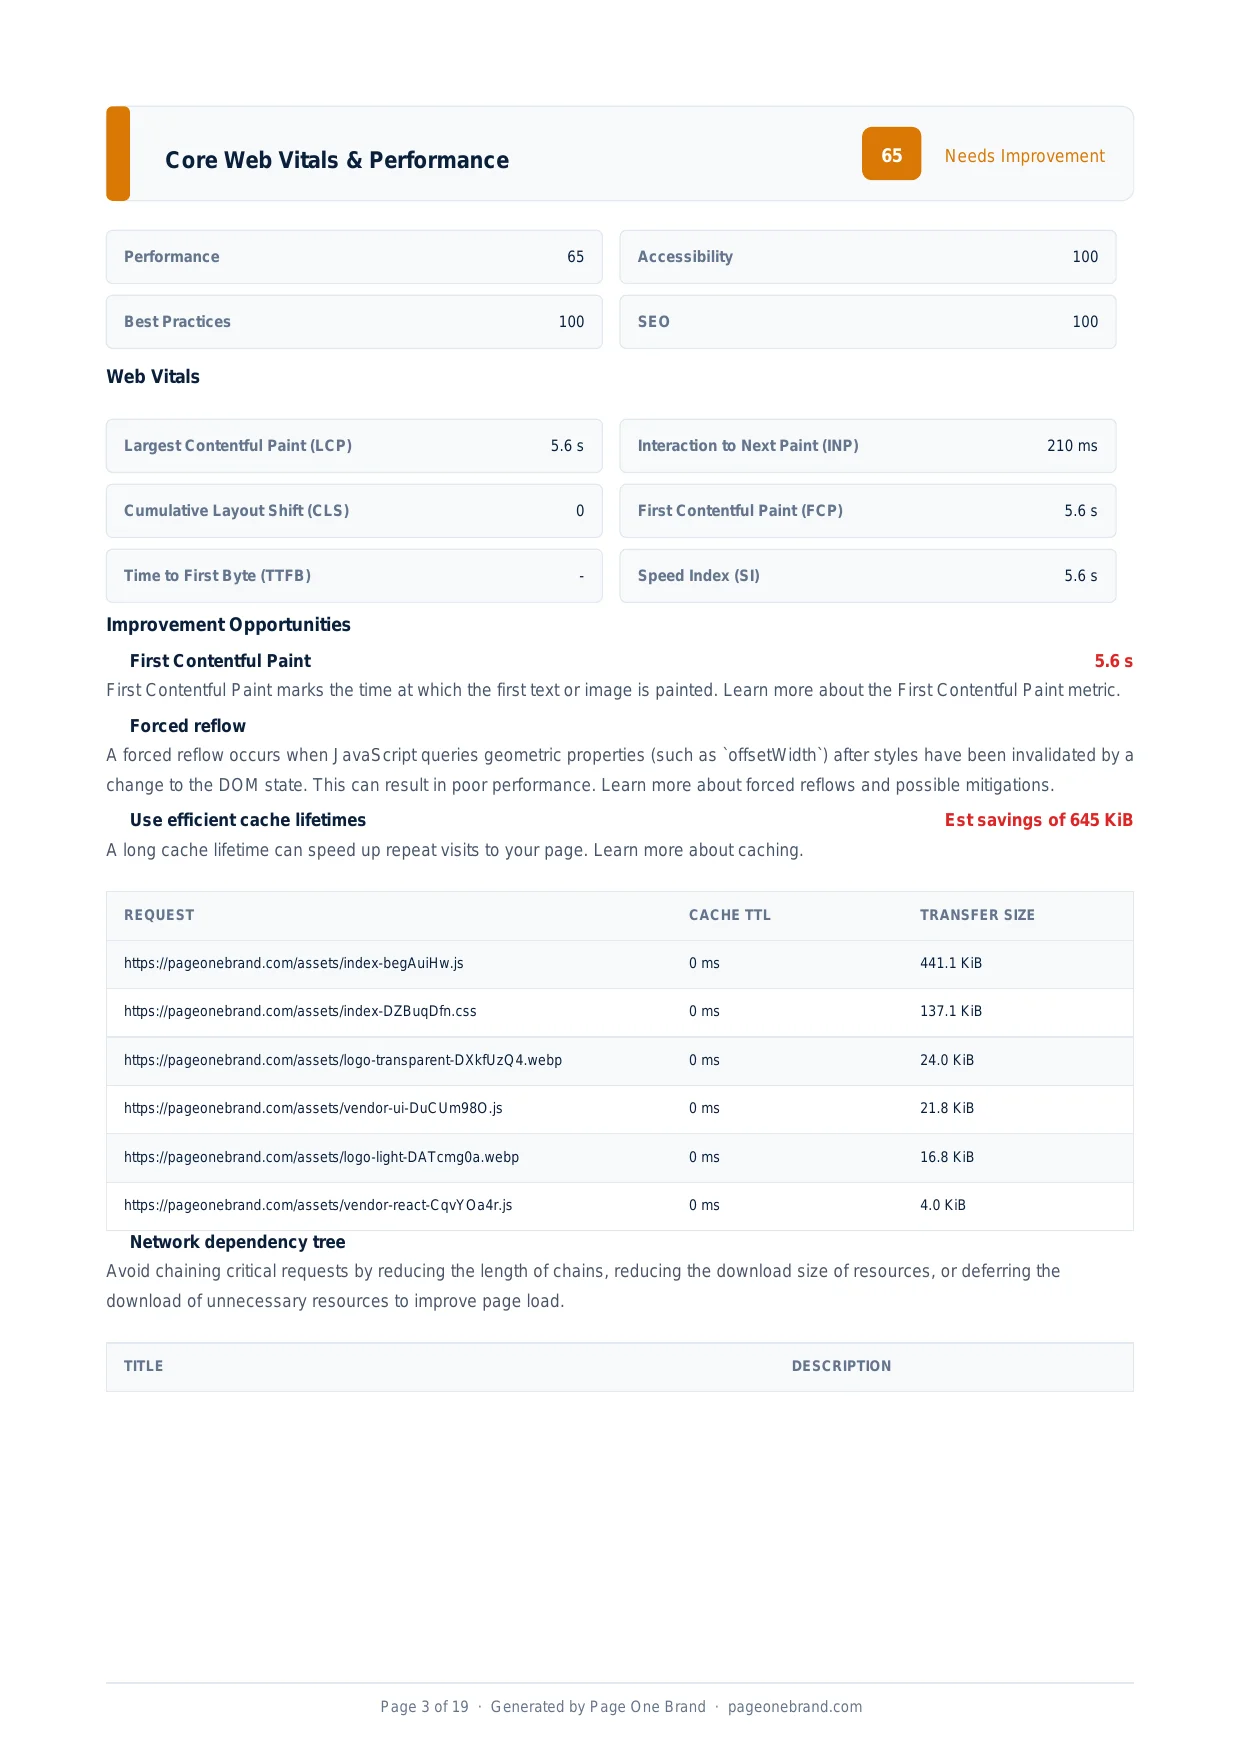
The Performance section of a real scan — live Core Web Vitals data pulled directly from Google's PageSpeed Insights API at the time of the scan.
The Core Web Vitals Explained
Google uses three primary metrics to assess page experience. Each has defined thresholds for Good, Needs Improvement, and Poor:
- Largest Contentful Paint (LCP) — measures how long it takes for the largest visible element to render. Good: under 2.5 seconds. Poor: over 4 seconds. LCP is most influenced by server response time, image optimisation, and render-blocking resources.
- Interaction to Next Paint (INP) — replaced First Input Delay in March 2024. INP measures how quickly the page responds to user interactions throughout the entire session. Good: under 200ms. Poor: over 500ms. INP is most affected by heavy JavaScript execution and long tasks on the main thread.
- Cumulative Layout Shift (CLS) — measures visual stability. Good: under 0.1. Poor: over 0.25. CLS is typically caused by images without declared dimensions or late-loading content injected above existing content.
The Page Quality Analyzer also reports supplementary metrics: First Contentful Paint (FCP), Time to First Byte (TTFB), Speed Index, and Time to Interactive — all pulled live from Google's PageSpeed Insights API at the moment of the scan.
How We Calculate the Performance Score
The Performance score is derived directly from Google's PageSpeed Insights API, called live for your URL at the time of analysis. This means the score reflects the actual state of your page at that moment — not a cached result, and not a simulation.
We use the Lighthouse Performance score as the primary input (0-100), then adjust based on Core Web Vitals threshold compliance. A page can score 70 in Lighthouse but still fail the Good threshold on LCP or INP — and those field-data failures carry the actual ranking consequence.
The report also surfaces specific improvement opportunities: which resources are blocking rendering, which images lack explicit dimensions, which JavaScript files could be deferred, and estimated savings in kilobytes for each fix.
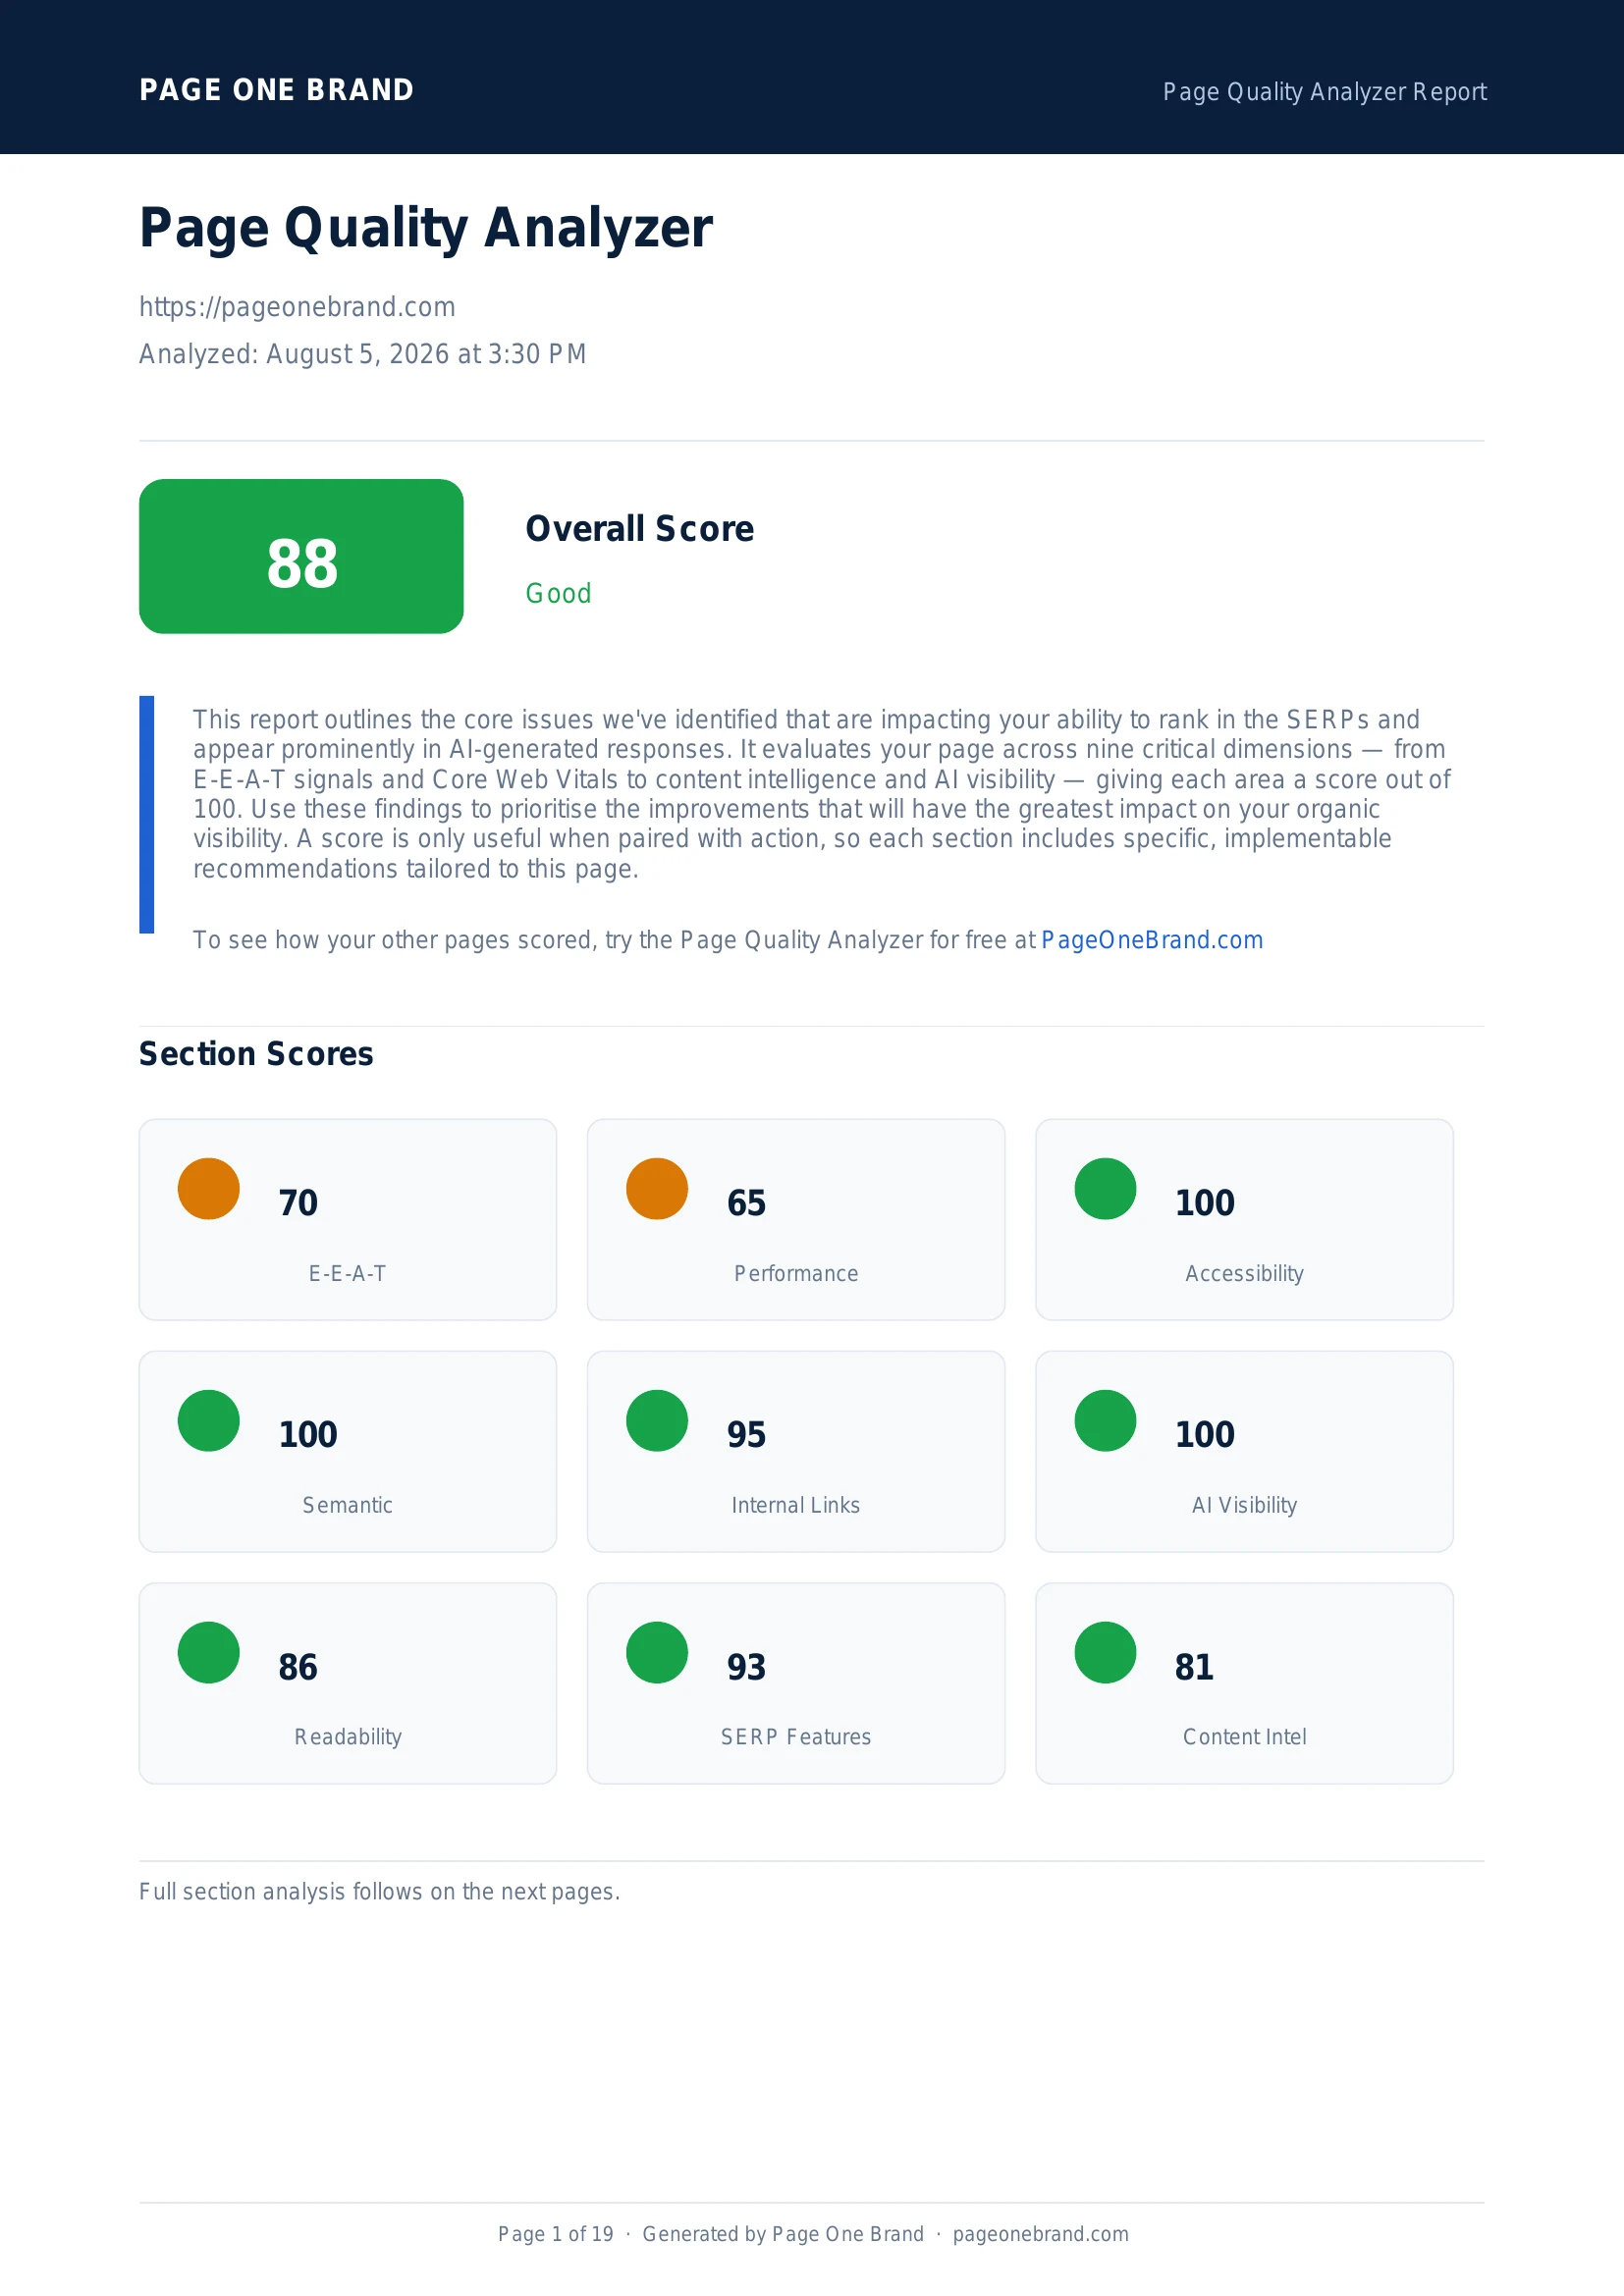 Performance is one of two structurally hard dimensions in the Page Quality Analyzer — improving it typically requires infrastructure and build changes, not just content edits.
How to Improve Your Performance Score
- Serve next-gen image formats. Switch from JPEG and PNG to WebP or AVIF. These formats reduce image payload by 25-50% with no perceptible quality loss.
- Add cache headers to static assets. JavaScript, CSS, images, and fonts should be cached aggressively. Zero cache on static assets wastes bandwidth on every visit and inflates LCP.
- Eliminate render-blocking resources. Scripts that load in the head without defer or async block the browser from painting anything. Move non-critical scripts to the end of the document or add defer.
- Preconnect to third-party origins. A preconnect link tag for each critical third-party origin saves 200-400ms per connection on fonts, analytics, and CDN assets.
- Reduce JavaScript execution time. Unused JavaScript is the single biggest performance drain on most websites. Audit your bundle and remove or defer anything not needed on initial load.
One important caveat: React and other single-page application frameworks carry inherent JavaScript overhead that makes hitting the Good Core Web Vitals thresholds genuinely difficult without server-side rendering or partial hydration. If your framework is the root cause, incremental fixes will only go so far — architectural changes may be necessary to reach the top tier.
Frequently Asked Questions About Core Web Vitals
What are the three Core Web Vitals Google uses as ranking signals?
Google uses three primary metrics to assess page experience: Largest Contentful Paint (LCP), which measures how long it takes the largest visible element to render (good: under 2.5 seconds); Interaction to Next Paint (INP), which replaced First Input Delay in March 2024 and measures how quickly the page responds to user interactions throughout the entire session (good: under 200ms); and Cumulative Layout Shift (CLS), which measures visual stability by quantifying unexpected layout shifts during load (good: under 0.1). These three together form the Core Web Vitals assessment that feeds into Google's page experience ranking signal.
How does Google collect real-user performance data for rankings?
Google collects real-user performance data through the Chrome User Experience Report (CrUX), which aggregates measurements from Chrome users who have opted in to sharing performance data. This data is collected over a rolling 28-day window and reported at the 75th percentile — meaning 75% of real users must experience a metric below the threshold for a site to pass. This field data differs significantly from Lighthouse lab scores, which run on simulated hardware under controlled network conditions. A page can have an excellent Lighthouse score but poor CrUX data if most real users are on slower connections or older devices. The Page Quality Analyzer calls Google's PageSpeed Insights API live, returning both lab and field data simultaneously.
Why is Performance one of the hardest dimensions to improve?
Performance is structurally difficult because the root causes are often architectural. JavaScript-heavy frameworks carry inherent overhead that makes hitting Good Core Web Vitals thresholds genuinely difficult without server-side rendering or partial hydration. A React single-page application that ships all application code in one bundle will always struggle with LCP and INP relative to a server-rendered page. Unoptimised images, missing cache headers, and bloated third-party scripts each compound the problem in ways that require infrastructure and build tooling changes — not just content edits. Incremental fixes help but may only go so far if the framework itself is the root cause.
What is the difference between LCP and INP, and why does each matter?
LCP — Largest Contentful Paint — is a loading metric: it measures when the largest visible element finishes rendering. It reflects how quickly users see the primary content of the page. INP — Interaction to Next Paint — is an interactivity metric: it measures the response latency of every user interaction throughout a real session, from clicks to key presses. LCP matters because slow loading drives abandonment before users can engage with content. INP matters because a page that loads quickly but freezes or delays when clicked creates frustration that undermines the experience. Both are Core Web Vitals with defined Good thresholds (LCP under 2.5s, INP under 200ms) that feed directly into Google's page experience ranking signal.